Figure 2.
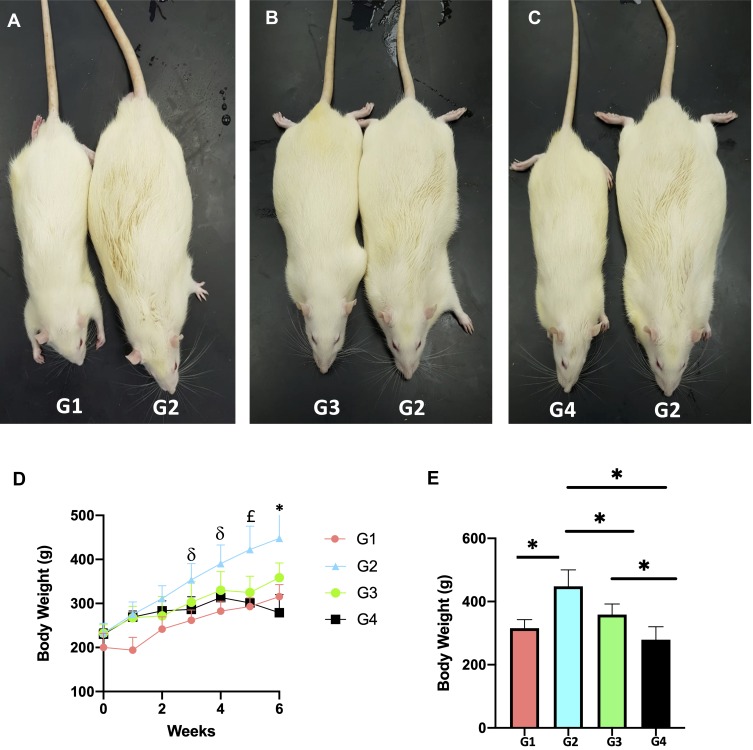
Effect of high-fat diet/disulfiram on rats at week 6. Dorsal view of: (A) G1 (SD) vs G2 (HFD), (B) G3 (HFD + 50mg DSF started at W0) vs G2 (HFD), (C) G4 (HFD + 200mg DSF started at W0) vs G2 (HFD). (D) Body weight of G1-G4 over the 6 weeks of the study. (E) Body weight of G1-G4 at week 6. Data are presented as mean ± SEM (n = 5 rats per group). ANOVA F=11.62 P < 0.001. δP < 0.05 between (G1 and G2) and (G2 and G4), £P < 0.05 between (G1 and G2), (G2 and G3) and (G2 and G4), *P < 0.05 between (G1 and G2), (G2 and G3), (G2 and G4) and (G3 and G4).

