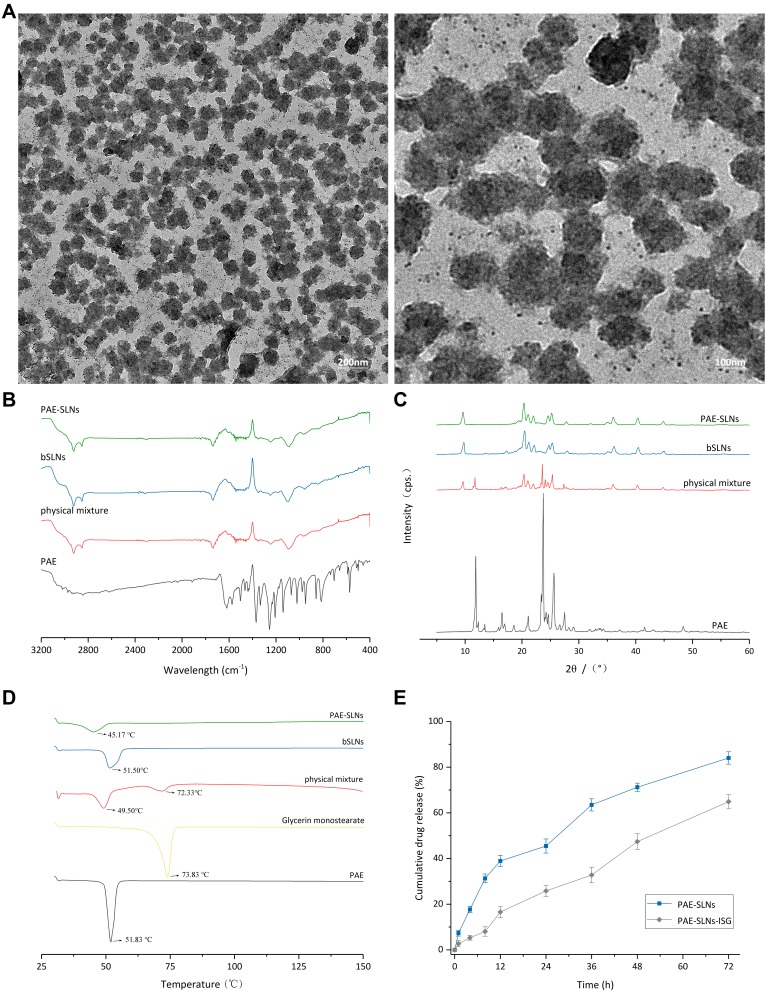
Figure 3.
(A) Transmission electron microscopy (TEM) images of PAE-SLNs. (B) Fourier transform infrared spectrum (FTIR) spectra of PAE, physical mixture, bSLNs and PAE-SLNs. (C) X-ray diffraction (XRD) patterns of PAE, physical mixture, bSLNs and PAE-SLNs. (D) Differential scanning calorimetry (DSC) thermographs of PAE, glycerin monostearate, physical mixture, bSLNs and PAE-SLNs. (E) In vitro release curves of PAE-SLNs and PAE-SLNs-ISG in SNF (34°C) over 72 h. Data are expressed as mean ± SD, n = 3.
Abbreviations: PAE, paeonol; PAE-SLNs, paeonol-solid lipid nanoparticles; PAE-SLNs-ISG, paeonol-solid lipid nanoparticles-in situ gel; bSLNs, blank solid lipid nanoparticles; SNF, simulated nasal fluid.

