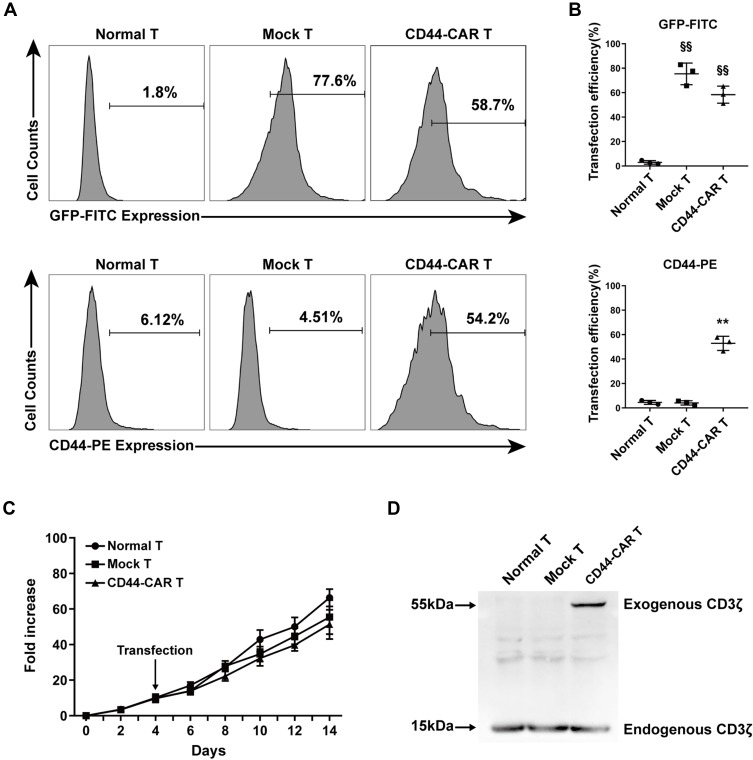
Figure 2.
CD44-CAR expression analysis. (A) Flow cytometry showed CD44-CAR expressed in human T cells seven days after transfection. Normal T cells were used as control groups. Mock T cells were generated by electroporating plasmid encoding GFP under the same condition of CD44-CAR T generation. (B) Transfection efficiency of GFP gene or CD44-CAR in normal T, mock T and CD44-CAR T cells. Statistics are presented as the means ± SDs, n = 3 per group, §§ P<0.05 vs normal T group; ** P<0.05 vs normal T and mock T groups. (C) Fold expansion of normal T, mock T and CD44-CAR T cells, all cells were cultured in vitro and activated by anti-CD3/CD28 mAb, IL-2/IL-15 and IFN-γ. Statistics are presented as the means ± SDs. n = 3 per group. (D) The CAR protein expression was represented by Western blot analysis. The exogenous CD3ζ was detected to illustrate CD44-CAR expression.

