Figure 3.
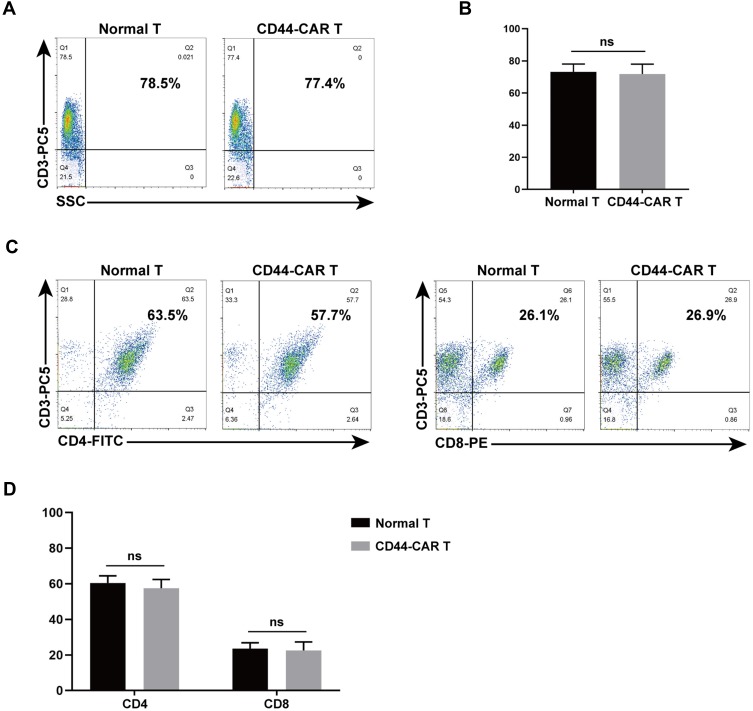
Phenotype analysis of normal T and CD44-CAR T cells. (A) After transfection, flow cytometry showed CD3 expression in normal T and CD44-CAR T cells on day 7. (B) No difference in normal T and CD44-CAR T cells of CD3 expression. Statistics are presented as the means ± SDs, n = 3 per group. ns, not significant. (C) Further analysis from CD3 positive cell populations, flow cytometry showed CD4 and CD8 expression in normal T and CD44-CAR T cells on day 7. (D) CD44-CAR T cells showed similar expression levels of CD4 and CD8 compared to normal T cells. Statistics are presented as the means ± SDs, n = 3 per group. ns, not significant.

