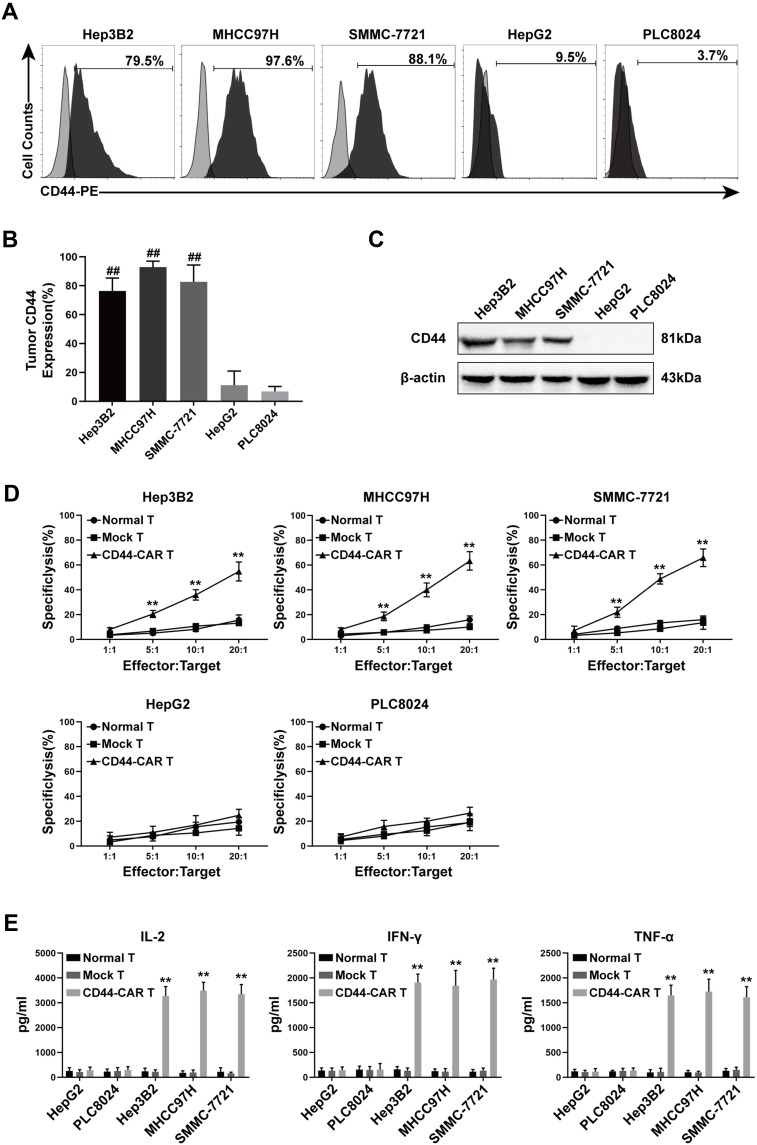
Figure 4.
CD44 expression in HCC cell lines and in vitro antitumor activity of CD44-CAR T cells. (A) Flow cytometry showed CD44 antigen expressed on tumor cell surface. The PE-conjugated anti-CD44 antibody used to stain five types of HCC cell lines and the anti-IgG1 antibody stained cells used as control groups. (B) Statistical analysis of CD44 expression on five types of HCC cell lines by flow cytometry. (C) Western blot analysis of CD44 protein expression on tumor cells. Anti-β-actin antibody used to stain control groups. (D) Cytotoxic activity analysis of CD44-CAR T cells. Five types of HCC cells cocultured with normal T, mock T and CD44-CAR T cells in increasing ratios (1:1, 5:1, 10:1 and 20:1) for 18 hours and CCK-8 assay used for detecting. (E) In vitro cytokine secretion (IL-2, IFN-γ and TNF-α) of CD44-CAR T cells analysis. Effector cells cocultured with target cells at a 10:1 ratio for 24 hours and ELISA assay used for detecting. All statistics are presented as the means ± SDs, n = 3 per group, ## P<0.05 vs HepG2 and PLC8024 groups; ** P<0.05 vs normal T and mock T groups.

