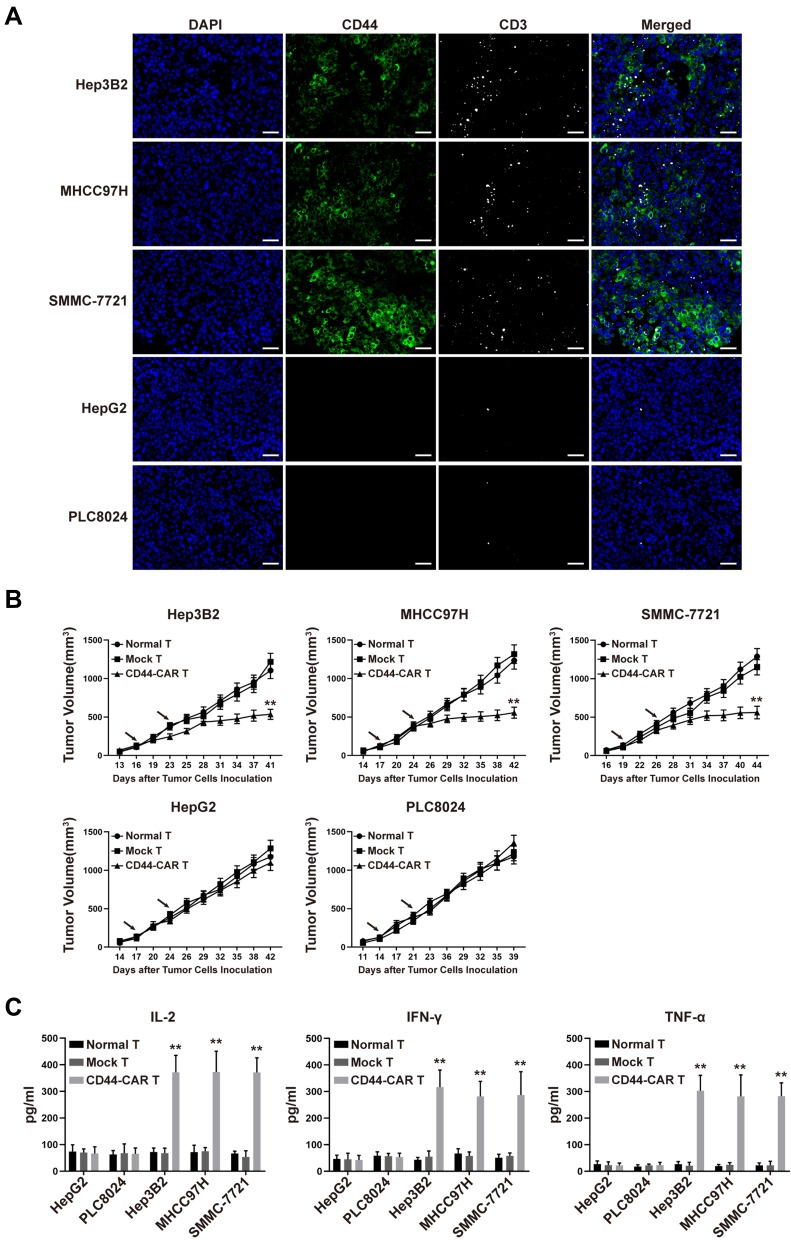
Figure 5.
In vivo antitumor activity of CD44-CAR T cells against HCC. (A) HCC xenograft mice were given 1×10⁷ effector cells treatment. After mice were sacrificed, tumor tissues of CD44-CAR T cells treated mice were harvested. Immunofluorescence images showed different CD44 expression and T cells infiltration (anti-CD3 staining) in five types of HCC cells. Scale bar = 50 μm. (B) After the tumor volume of xenograft mice reached about 100mm3, effector cells were injected twice (arrows marked). The volumes of xenograft mice tumors were recorded for statistical analysis. (C) One hundred μL of peripheral blood from treated mice on day 7 were obtained for the in vivo cytokine secretion assay according to the ELISA kit instrument. All statistics are presented as the means ± SDs, n = 5 for each group, ** P<0.05 vs normal T and mock T groups.

