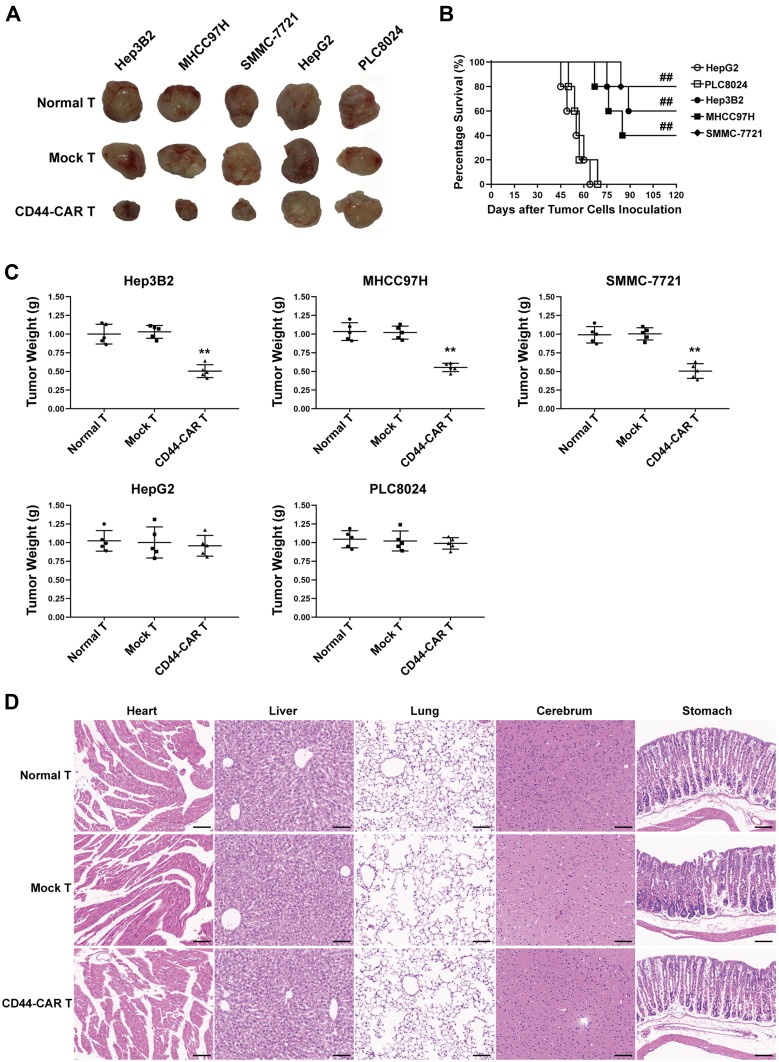
Figure 6.
Tumor suppression capacity and safety of CD44-CAR T cells. (A) Tumor tissue images of sacrificed mice with different effector cell treatments had exhibited. (B) Survival time of xenograft mice with five types of HCC inoculation. Statistics were compared by the log-rank (Mantel-Cox) test, ## P<0.05 vs HepG2 and PLC8024 groups. (C) Statistical analysis showed the tumor weight of sacrificed mice. Statistics are presented as the means ± SDs, n = 5 for each group, ** P<0.05 vs normal T and mock T groups. (D) After sacrificing, the important organs of xenograft mice were obtained and cut into sections for H&E staining. Images of normal T, mock T and CD44-CAR T cells groups of sections were exhibited. Scale bar=100 µm.

