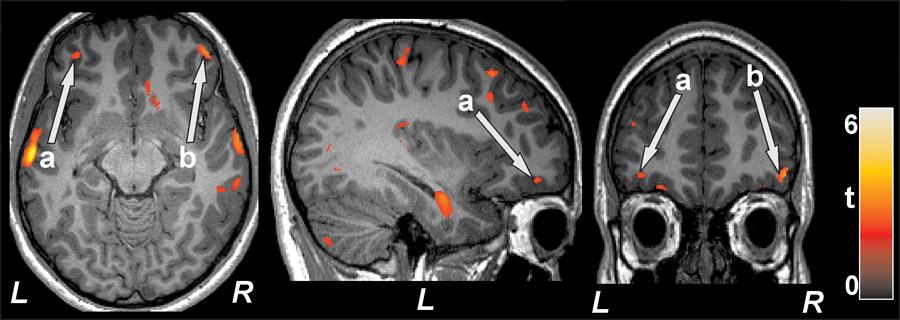
Figure 2.

Left prefrontal cortex (a; axial, sagittal) and right prefrontal cortex (b; axial, coronal) showed significant positive correlation with MoCA scores in T2DM subjects. All images are in neurological convention (L = left; R = right). Color bar indicates t-statistic values.
