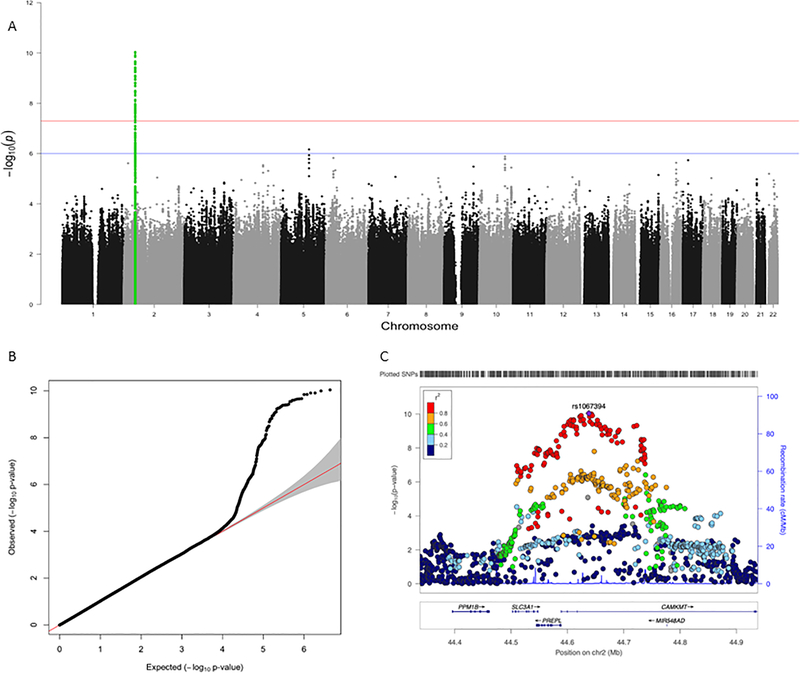
Figure 2:
Results for the combined meta-analysis of the European ancestry subjects from STARRS+ANGST (N=28,963).
Notes: Panel A presents the Manhattan plot. The x-axis is chromosomal position and the y-axis is the –log10 of the p-value for the association derived by linear regression. The blue line denotes the suggestive significance threshold (1 × 10⁻⁶), and the red line denotes genome-wide significance (5 × 10⁻⁸). SNPs highlighted in green represent the region of chromosome 2 that was previously associated with the latent anxiety dimension in ANGST. Panel B presents the QQ plot of the associations for the meta-analysis. Panel C displays the locus zoom plot for the associated region.

