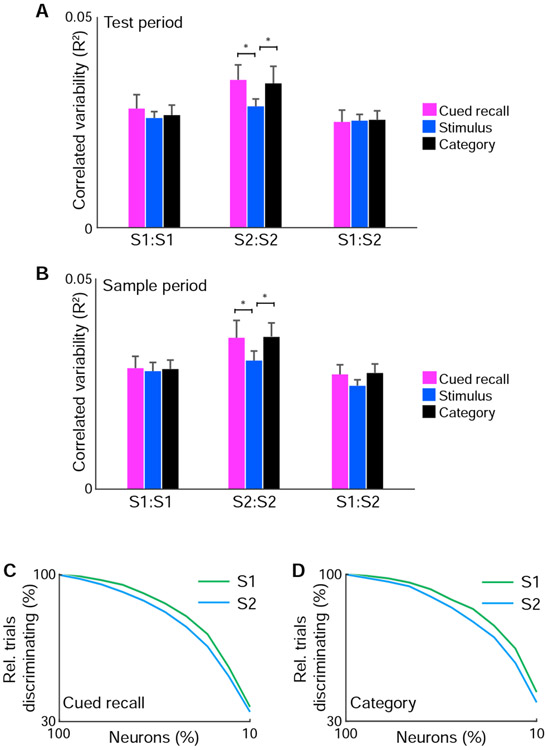
Figure 8. Network differences between S1 and S2.
(A) Mean correlated variability during the test period from simultaneously imaged neurons of similar response properties for neuronal pairs within S1 (S1:S1), within S2 (S2:S2), and between S1 and S2 (S1:S2). (B) Mean correlated variability during the sample period from simultaneously imaged neurons of similar response properties for neuronal pairs within S1 (S1:S1), within S2 (S2:S2), and between S1 and S2 (S1:S2). (C) Population discriminability of cued recall information in S1 vs. S2 as function of fraction of simultaneously imaged neurons included for linear discriminant analysis. (D) Population discriminability of category information in S1 vs. S2 as function of fraction of simultaneously imaged neurons included for linear discriminant analysis. n = 57 imaged populations. * P < 0.05. Error bars: s.e.m.

