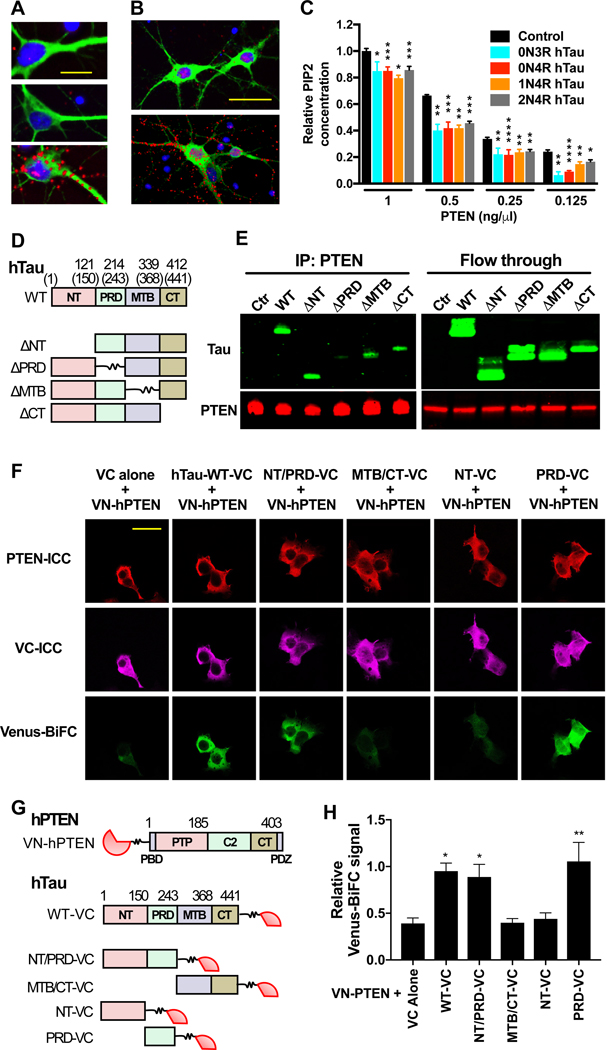
Figure 5 |. Tau Interacts with PTEN through Tau’s PRD and Restrains PTEN’s Lipid Phosphatase Activity.
(A–B) Colocalization of tau and PTEN in primary cortical neurons analyzed by PLA. (A) WT rat neurons (DIV 10) were labeled with the tau antibody Tau5 (top), a PTEN antibody (middle), or both (bottom). The PLA signal (red) indicates close proximity of the antigens. Neurons were counterstained with DAPI (blue) and an antibody to MAP2 (green). Scale bar: 30 μm. (B) Mapt−/− mouse neurons were transduced on DIV 7 with lentiviral vectors encoding GFP alone (top) or GFP and 0N4R mouse tau (bottom), labeled with antibodies against tau (Tau5) and PTEN, and subjected to PLA on DIV 10. Scale bar: 50 μm. Some of the PLA signals in (A) and (B) appear to reside outside of cells because of weak MAP2 or GFP staining of the fine neuritic processes with which they are associated. (C) Lipid phosphatase activity of PTEN measured under cell-free conditions in the presence of different recombinant human tau species. Albumin was used as the negative control (Control). n = 3 independent experiments, each including two to three replicates per condition. To combine data from independent experiments, measurements in (C) were normalized to the mean PIP2 concentration at 1 ng/μl PTEN with albumin (defined as 1.0). (D–H) Analysis of interactions between hTau and hPTEN in transiently transfected HEK-293 cells. (D) Schematic of WT 1N4R hTau and deletion mutants lacking the indicated domains. Numbers indicate amino acid positions in 1N4R hTau and those in parentheses in 2N4R hTau. (E) Western blot analysis of immunoprecipitates (left) and column flow through (right) from cells expressing GFP-P2A alone (Ctr) or the constructs in (D), after immunoprecipitation of cell lysates with an antibody against PTEN. Blots were probed with antibodies to tau (Tau46 plus Tau5) and PTEN. Similar results were obtained in two additional experiments (not shown). (F and G) BiFC assay of HEK-293 cells expressing the constructs indicated at the top in (F) and shown in (G). WT human PTEN (hPTEN: PBD, PIP2 binding domain; PTP, protein tyrosine phosphatase domain; CT, C-tail domain) was tagged with VN, and WT 2N4R hTau and its mutants were tagged with VC. Numbers indicate amino acid positions in hPTEN and 2N4R hTau. hPTEN and VC were detected by immunocytochemistry (ICC). Interactions between VN-hPTEN and hTau-VC were detected by Venus fluorescence resulting from close proximity between VN and VC. Scale bar: 40 μm. (H) Quantitation of BiFC-Venus signals normalized to VC immunoreactivity. n = 3 independent experiments, each including two to three coverslips/condition. *P < 0.05, **P < 0.01, ***P < 0.001, ****P < 0.0001 vs. PTEN concentration-matched control (C) or VC alone (H), determined by multiple Welch’s t tests (C) or one-way ANOVA with Holm-Sidak test (H). n.s., not significant. Values are means ± SEM.

