
Figure 2. HIVADA has a neurotoxic profile similar to gp120.
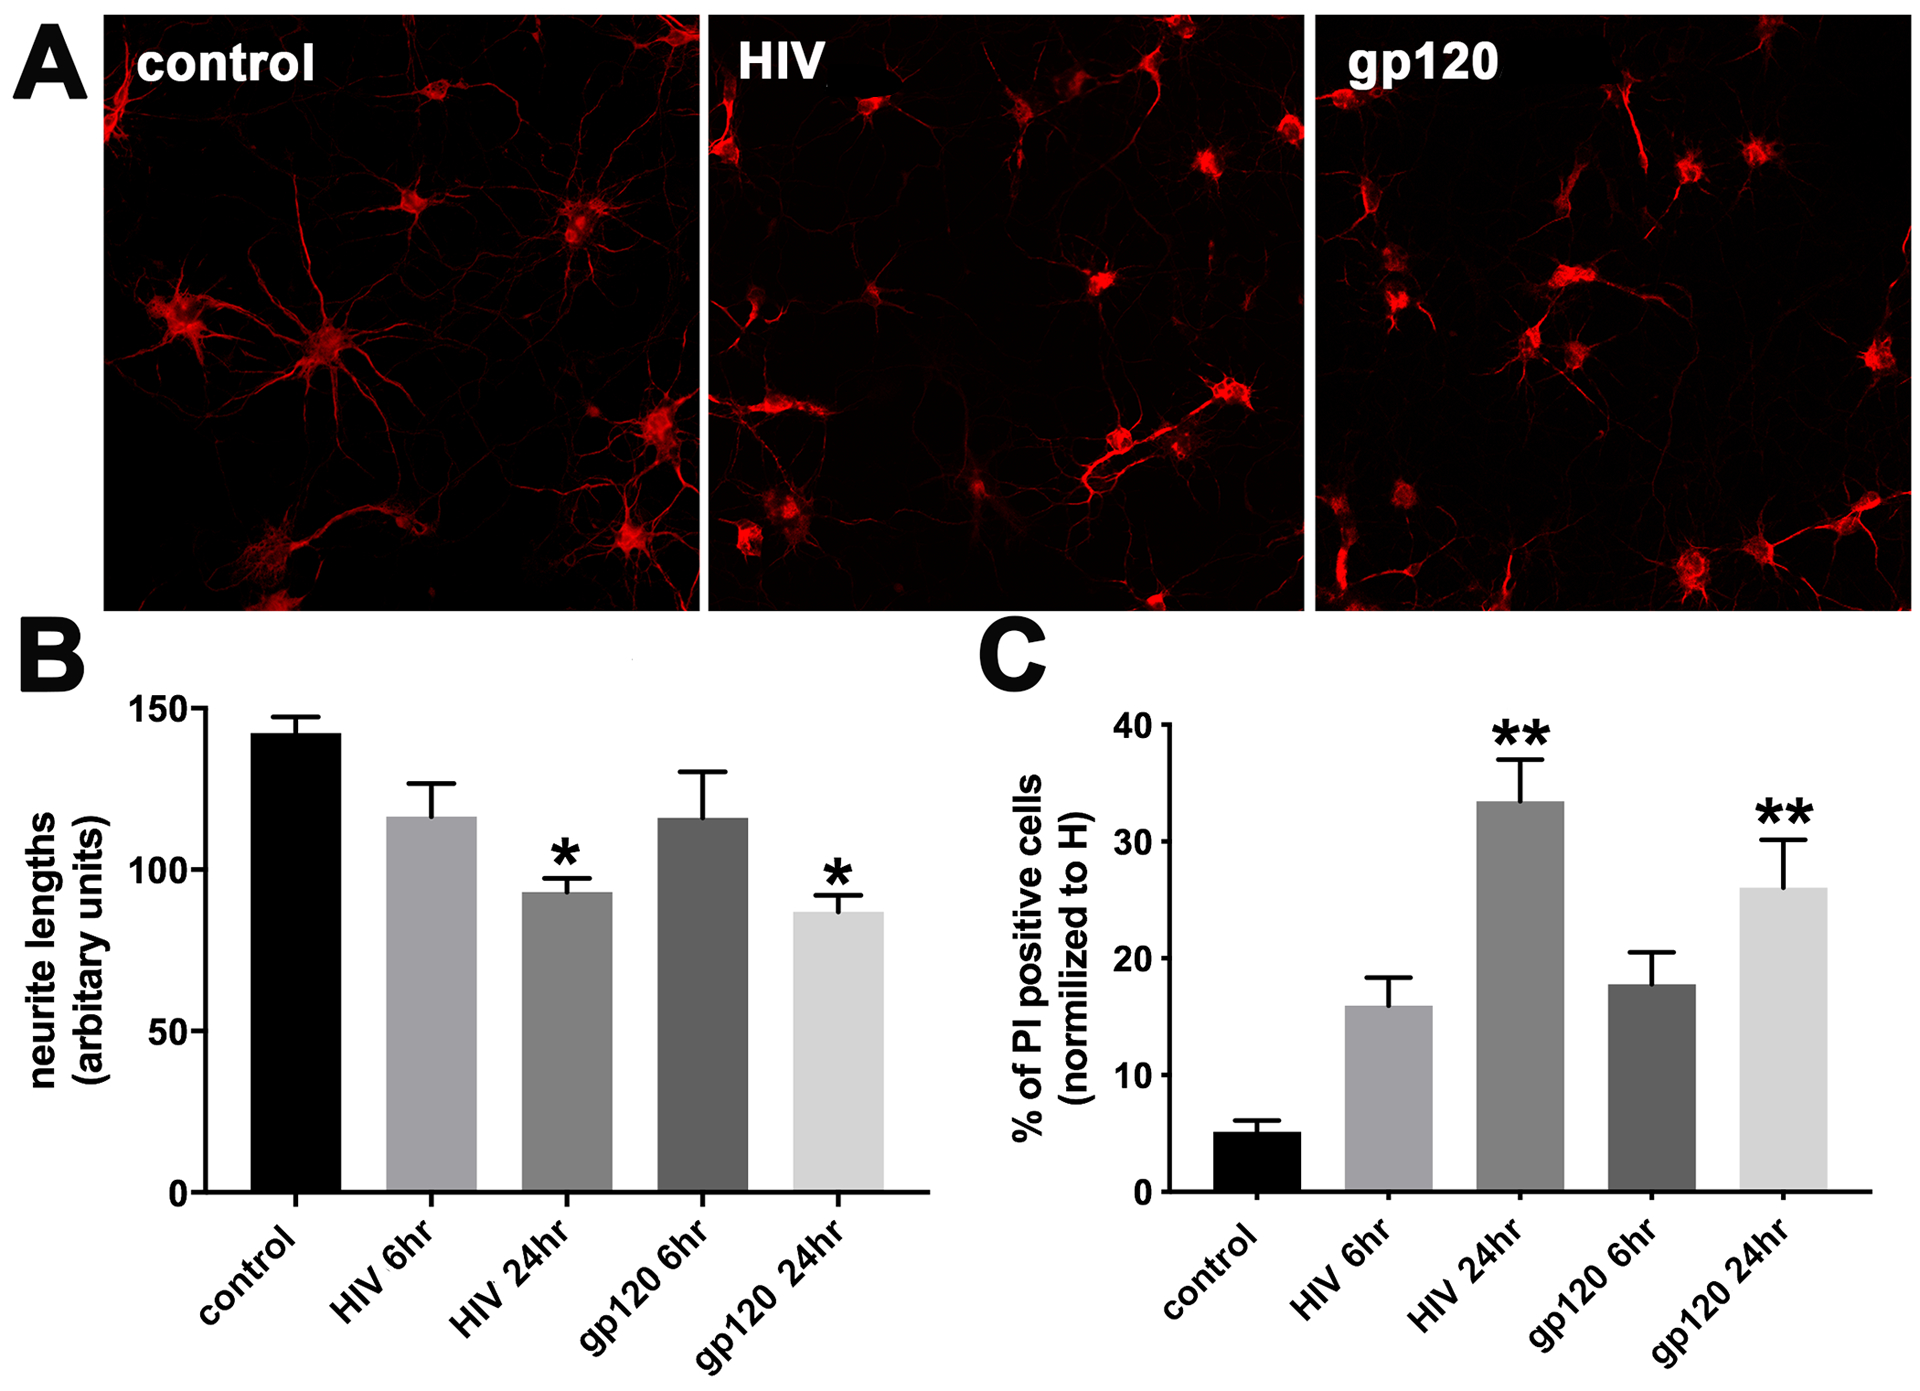
Cortical neurons were exposed to boiled HIVADA (control), HIVADA or gp120ADA for 6 and 24 hr. A. Representative images of neurons exposed for 24 hr to the indicated stimuli and stained for MAP2. B. Neurite length was measured by Image J as described in Materials and Methods. Data are the mean ± SD of three separate experiments. C. Neuronal viability was determined by counting the number of neurons positive for PI. Data are the mean ± SD of three separate experiments. *p<0.01 and **p<0.001 vs control (ANOVA and Tukey’s test).