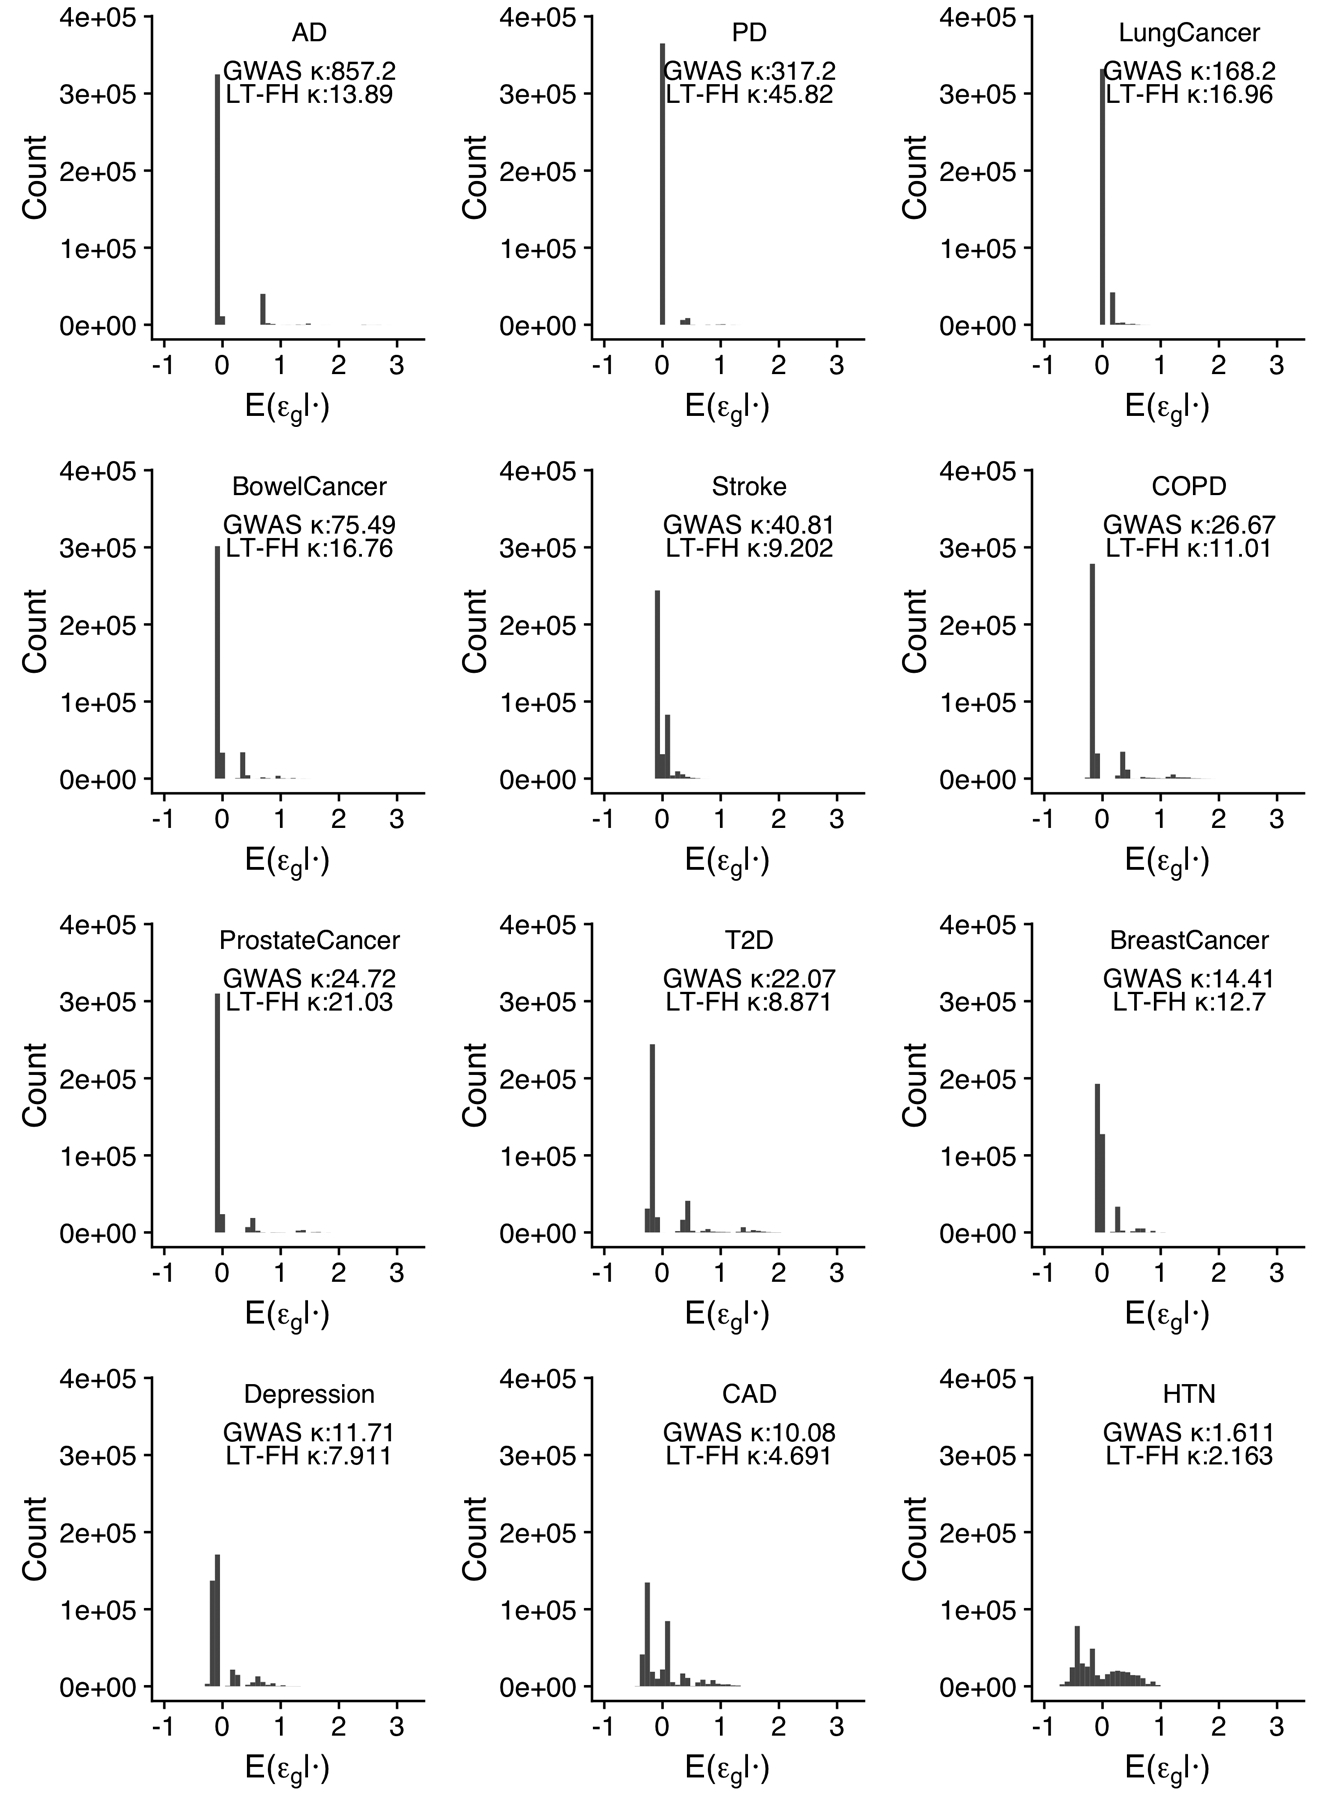
Extended Data Fig. 2. Distribution of LT-FH phenotypes for 12 UK Biobank diseases.

We plot the distribution of the LT-FH phenotype for each disease. We also report the kurtosis for both GWAS and LT-FH; Pearson’s measure of kurtosis, , is calculated using the R package moments.
