
Figure 7. Redox sensor evaluation of ROS production in isolated myocytes.
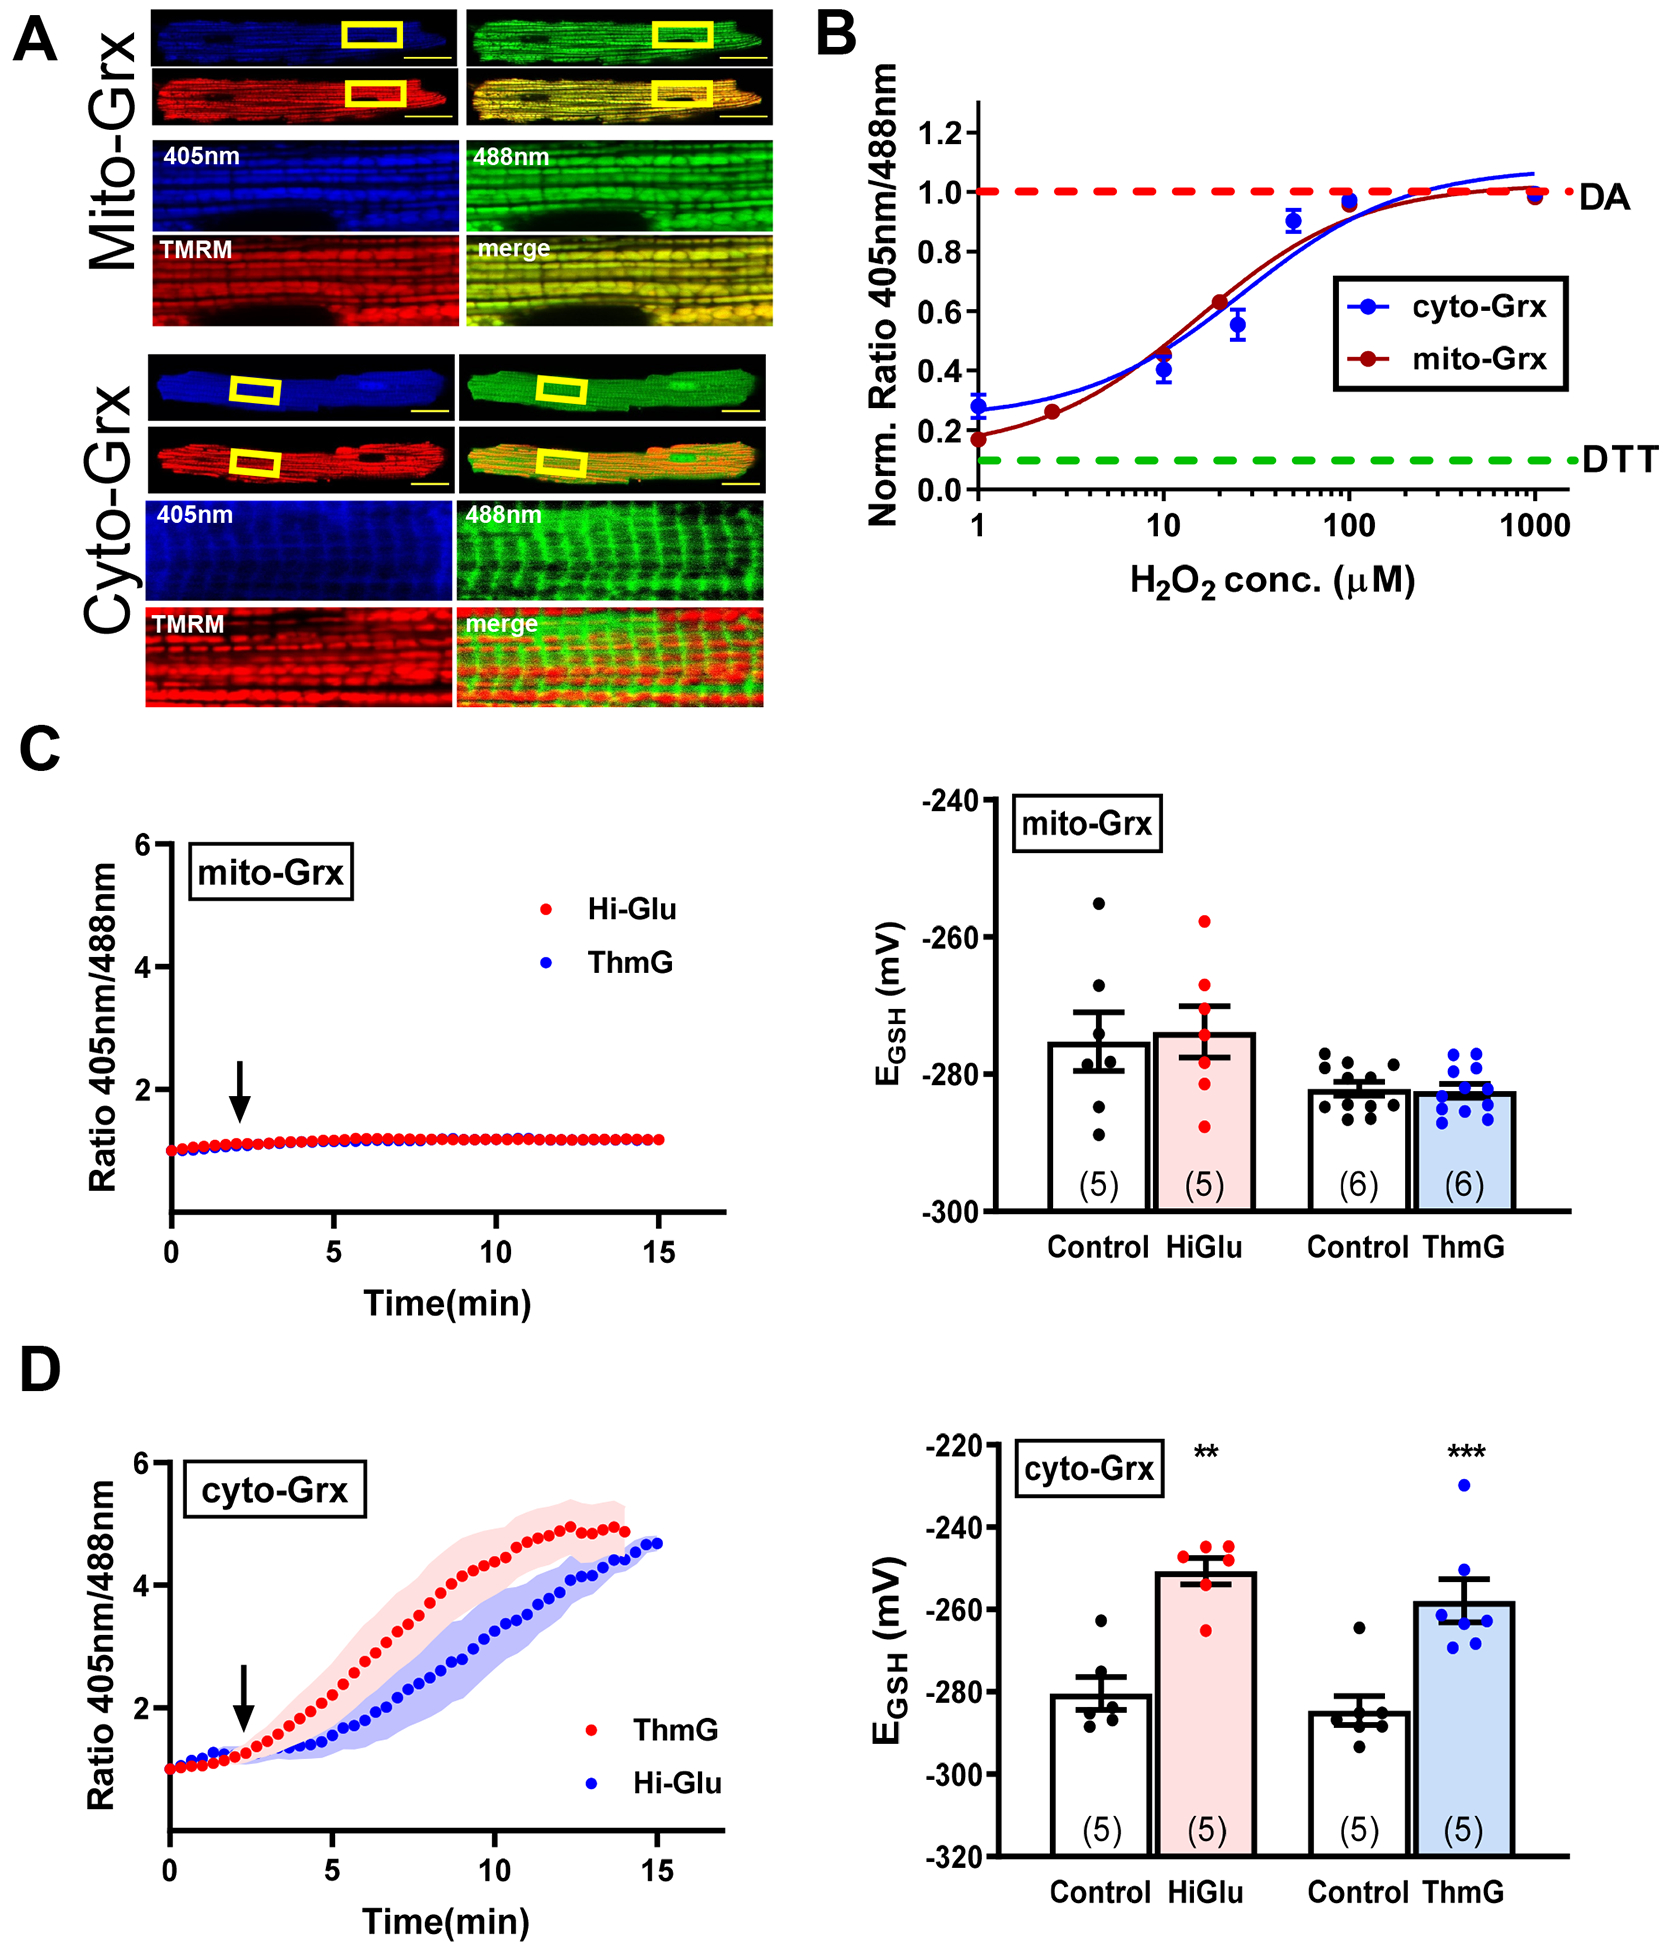
(A) Representative confocal images of myocytes expressing cyto- and mito-Grx redox sensors with 20 μm scale bar. (B) In situ redox sensors calibration. (C) Representative traces of mito-Grx ratio metric signal and converted EGSH in response to Hi-Glu/ThmG. (D) Representative traces of cyto-Grx ratio metric signal and converted EGSH in response to Hi-Glu/ThmG. (**P<0.01, ***P<0.001).