
Figure 8. ROS generation and SR Ca2+ handling in hiPSC-CMs.
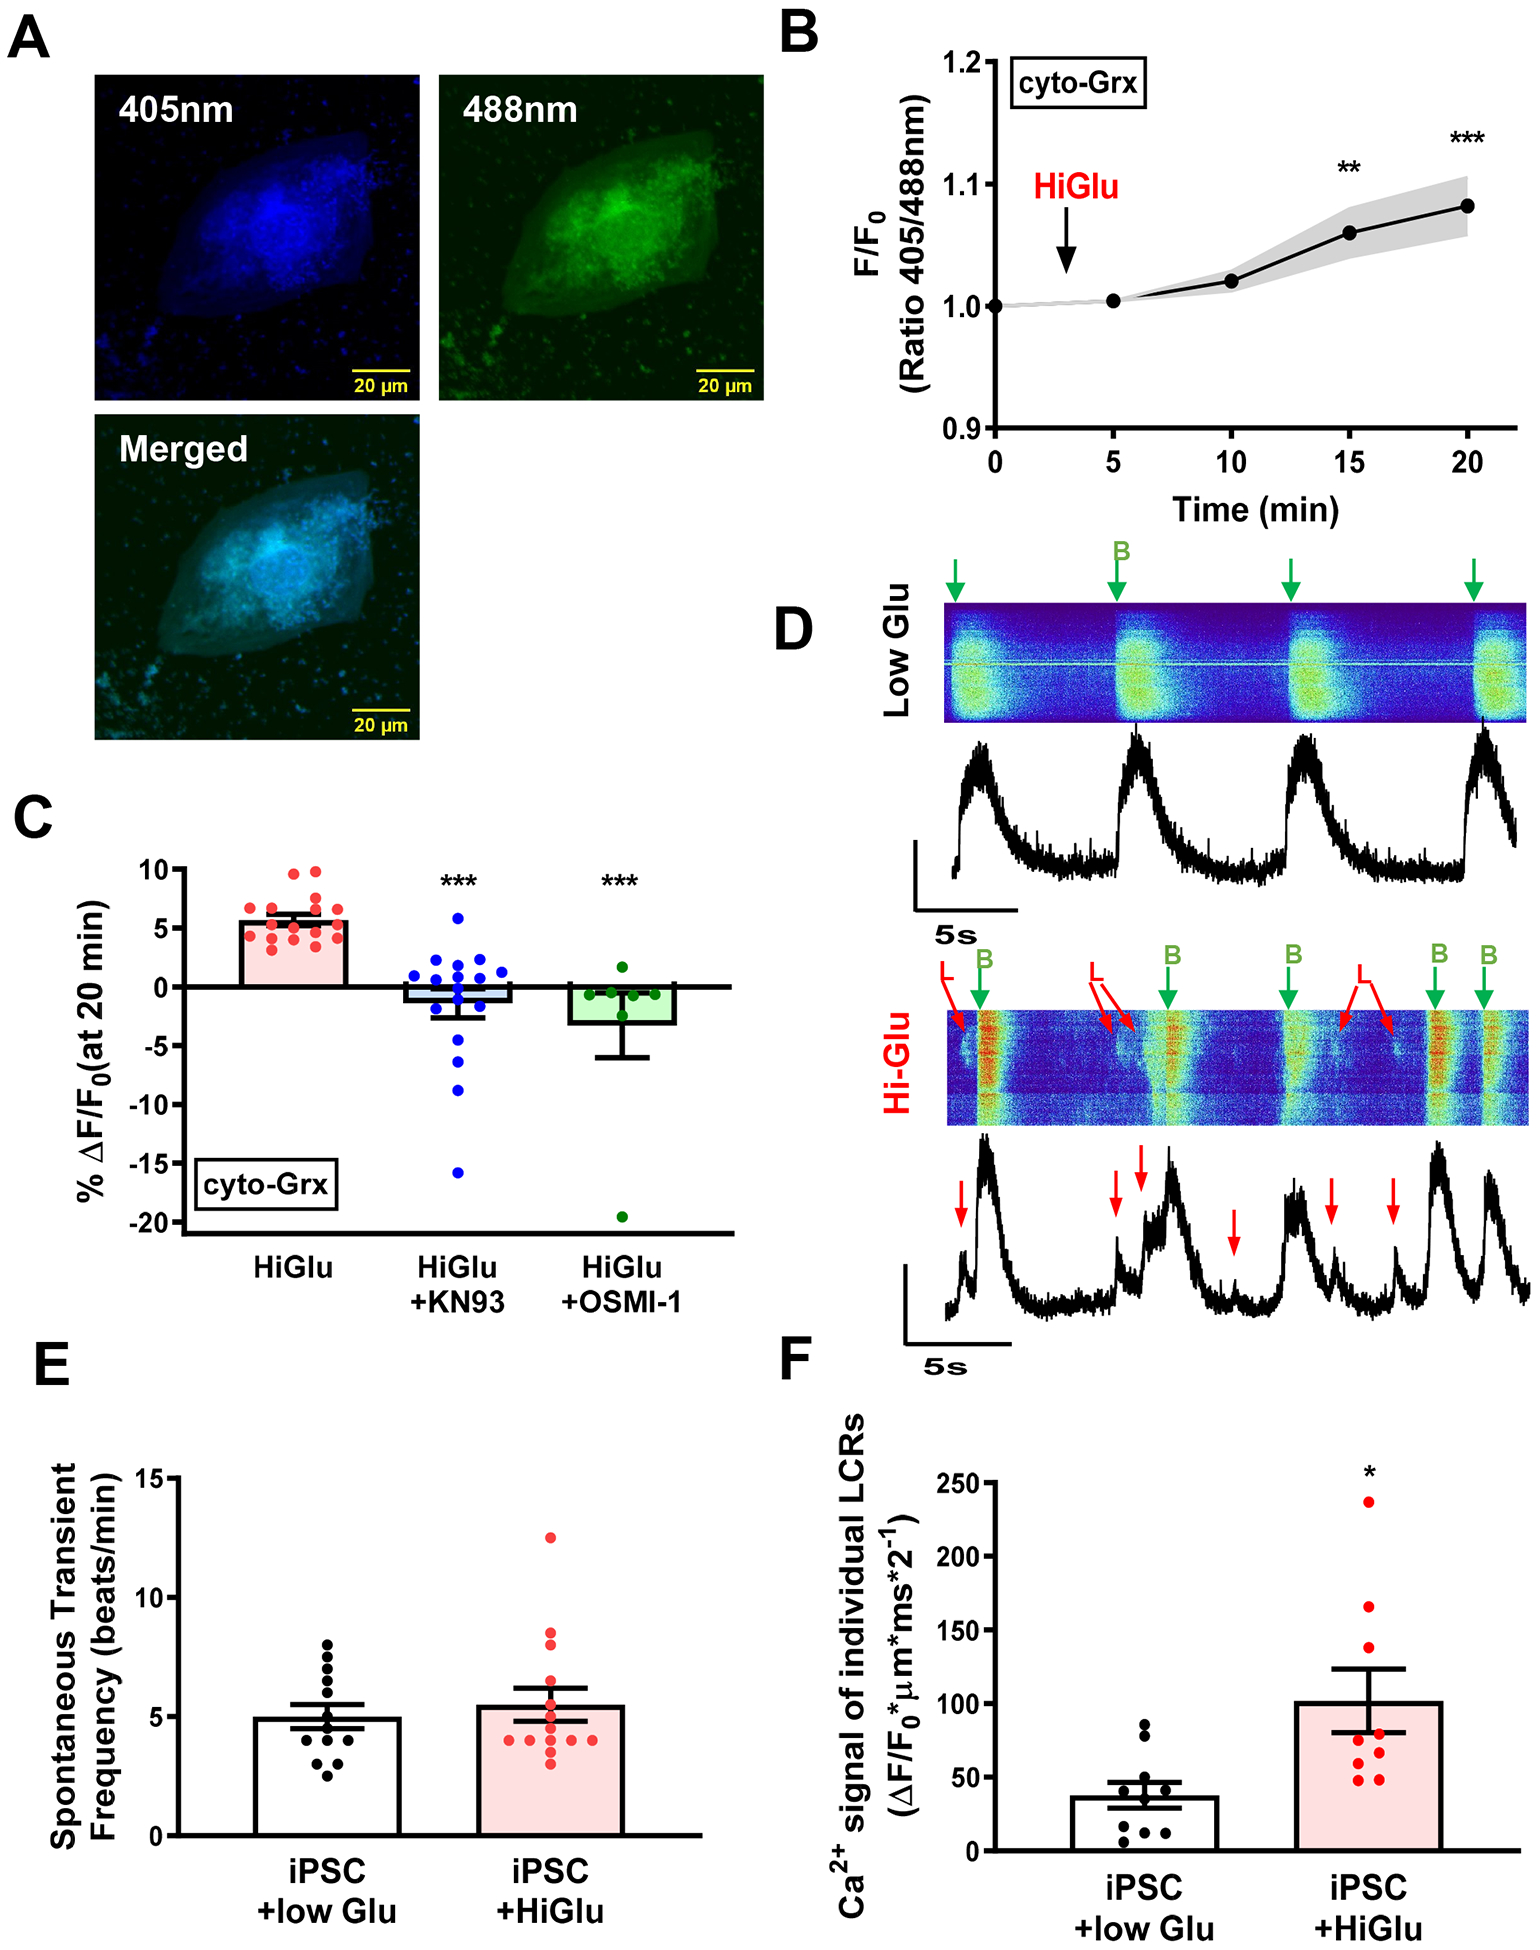
(A) Representative confocal images of hiPSC-CMs expressing adenovirus carried cyto-Grx redox sensor. (B) Average ratio metric change with Hi-Glu. (C) Hi-Glu induced ROS production could be inhibited by KN93 and OSMI-1, respectively. (D) Line-scan image of Ca2+ transients and LCRs. B, Transient; L, LCRs. (E) No change of spontaneous transient frequency with Hi-Glu. (F) Hi-Glu induced LCRs in hiPSC-CMs. (*P<0.05, **P<0.01, ***P<0.001)