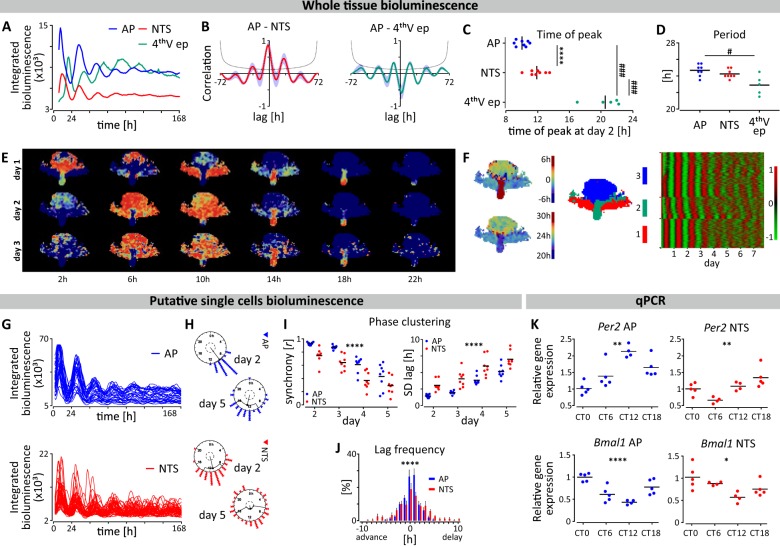
Fig. 1. Spatiotemporal variation in Per2/PER2 in the AP and NTS.
a Example traces of PER2::LUC expression over 7 days in culture at the whole tissue level in the AP, NTS and 4thVep from one brainstem slice. b Cross-correlograms showing the ~2 h lag of NTS to AP (left panel; n = 8) and close to antiphasic relationship of 4thVep to AP (right panel; n = 5) over 72 h. c Altered times of peak PER2::LUC bioluminescence (AP vs NTS ****p < 0.0001, n = 8, t test; 4thVep vs AP and NTS ###p < 0.001, n = 5, Tukey’s test). d Periods of whole area structures of the brainstem (#p < 0.05, n = 5, Tukey’s test). e Reconstructed images from grid-based, normalised PER2::LUC activities in the brainstem slice showing phase of spatial PER2::LUC expression every 4 h over 3 days. Warm colours code toward peak phase. f (from left to right) The average phase of the oscillation for the first 24 h in culture (upper left) and the period for the first 48 h (lower left), the map of clustering based on the correlation of time series (middle), and the raster plot of normalised time series of the oscillation listed in cluster groups (each row represents one grid) (right). The first cluster (red) approximates the anatomical position of NTS, the second one (green) the 4thVep, and the third cluster (blue) the AP (middle). g Traces of putative single cell PER2::LUC expression over 7 days in culture. h Rayleigh plots depicting phase clustering around CT 8.5 in AP and CT 11 in NTS at day 2, and subsequent desynchronisation of single cell oscillators at day 5. i Rayleigh r value of individual cells for peaks 2-5 (left panel) and the SD of individual cell lags relative to the phase of the main structure for peaks 2-5 (right panel) for n = 8 cultures. (****p < 0.0001, two-way ANOVA RM). J. Frequency histogram of single cell lags relative to the phase of the whole structure (****p < 0.0001, two-way ANOVA Interaction). k In vivo core clock gene expression of Per2 and Bmal1 in the AP and NTS relative to CT0. (*p < 0.05, **p < 0.01, ****p < 0.0001, one-way ANOVA).

