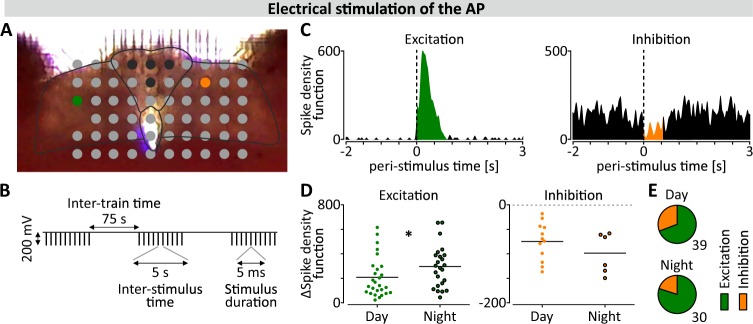
Fig. 3. Daily changes in AP to NTS communication.
a Photograph showing the position of the brainstem section on the electrode array; black represents stimulation sites, green and orange represent electrodes where the example excitatory and inhibitory responses (shown in c) were recorded. Black lines delineate structures: the AP and the borders of DVC. b Schematic representation of the stimulation protocol. c Representative excitatory and inhibitory responses in the NTS shown in modified peri-stimulus time histograms (PSTHs) representing the sum of spike density function around 30 stimuli. d Amplitudes of nocturnal excitations were significantly higher than those recorded during the day (*p = 0.042, Mann–Whitney test), but inhibitory responses did not show this day-to-night increase (p = 0.336, Mann Whitney test). e Proportion of excitations (in green) to inhibitions (in orange) recorded at day and night.

