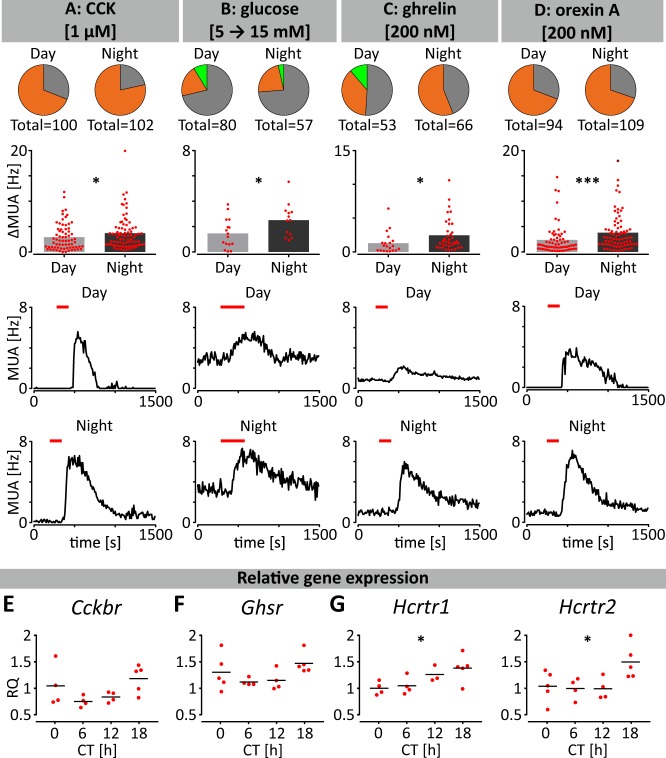
Fig. 6. Day-night variation in responsiveness of NTS neurons to metabolic factors.
a–d Multi-electrode array recordings conducted during the day (ZT4-6) or night (ZT16-18) reveal that NTS neurons increased nocturnal responsiveness to (a) CCK, (b) elevated glucose, (c) ghrelin, and (d) orexin A. Pie charts represent the proportion of NTS recording locations responding through activation (orange), inhibition (light green) or no change in firing activity (grey). Bars represent the amplitude of drug-evoked excitation or inhibition (*p < 0.05, ***p < 0.001 t test or Mann–Whitney test). Multi-unit activity traces showing representative responses to drug application during the day or night are presented below. e–g Temporal variation in gene expression for metabolic receptors in the NTS sampled at CT0, 6, 12, and 18. Data are plotted relative to the values at CT0. Orexin receptor gene expression (Hcrtr1 and Hcrtr2) varied across these time points. *p < 0.05, one-way ANOVAs or Kruskal–Wallis tests.

