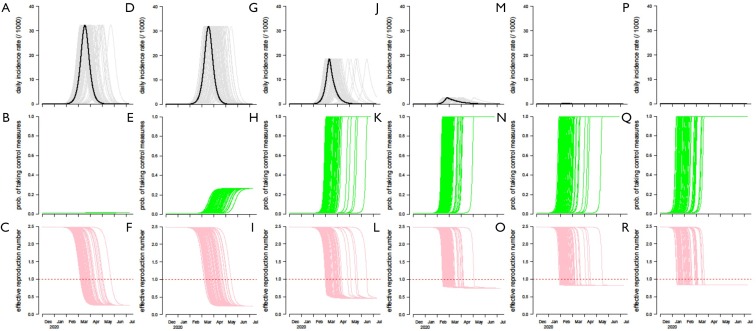
Figure S1.
The simulation results with 0-fold (baseline, A,B,C), 10-fold (D,E,F), 100-fold (G,H,I), 1000-fold (J, K and L), 10,000-fold (the most realistic scenario, M,N,O) and 100,000-fold (P,Q,R) increase in κ and α unchanged at baseline level. The top panels (A,D,G,J,M,P) show the daily incidence rate with unit at per 1,000 population, which is the same scale as in Figure 4 of Wu et al. (10). The middle panels (B,E,H,K,N,Q) show the changing dynamics of the willingness to take infection prevention actions (p). The bottom panels (C,F,I,L,O,R) show the changing dynamics of the effective reproduction number (Reff), and the level 1 is highlighted by the horizonal red dashed line. The curves in light colors represent 1,000 simulation samples.

