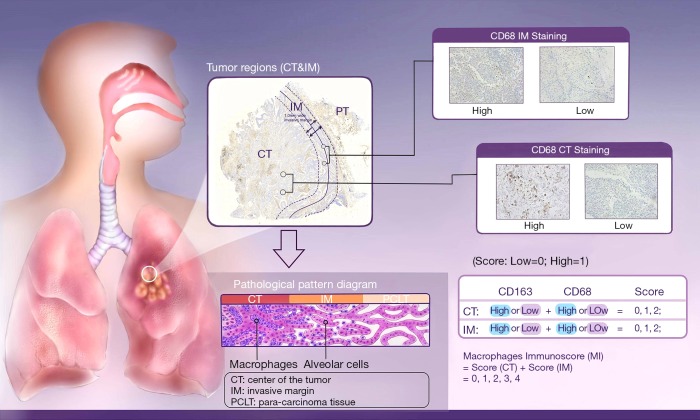
Figure 1.
The MI definition and methodology. The box on the upper left illustrated the division of the center of the tumor (CT) and invasive margin (IM) based on H&E section of NSCLC (original magnification, ×200) as well as the pathological differences between these two regions displayed by the pathological pattern diagram at the bottom left. The IM was defined as the region centered on the border separating the host tissue from the malignant nests, with an extent of 1 mm. Center of the tumor corresponded to all the tissue inside the IM, and para-carcinoma tissue (PCLT) corresponded to tissue outside of the IM (9). Two boxes on the upper right showed four representative IHC images of CD68 CT staining and CD68 IM staining. The table on the bottom right demonstrated the Establishment of a Macrophages Immunoscore based on the enumeration of two macrophages populations (CD163 and CD68) in CT and IM. Each tumor is categorized into high or low density for each marker in each tumor region according to a predetermined cutoff value. Patients are stratified according to a score ranging from 0 to 4, depending on the total number of high densities observed (two markers assessed in CT, two markers assessed in IM).

