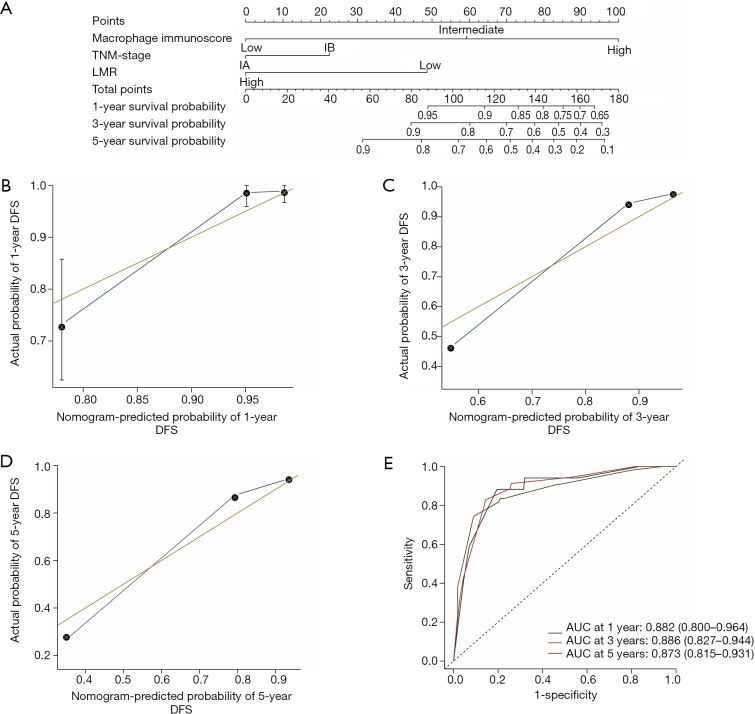
Figure 3.
Nomogram for predicting the risk of disease progression of stage I NSCLC patients in the training cohort. (A) The nomogram for predicting the probability of patients with 1-, 3-, and 5-year DFS. Lymphatic and Vascular Invasion is a combination of lymphatic invasion and vascular invasion, where the patients with both lymphatic and vascular invasion were divided into high Lymphatic and Vascular Invasion while the rest were divided into low Lymphatic and Vascular Invasion. (B) Calibration curve for a 1-year DFS nomogram model. The orange line represents an ideal nomogram, and the blue line represents the observed nomogram. Vertical bars indicate 95% confidence intervals (CIs), and crosses indicate bias-corrected estimates. (C) Calibration curve for a 3-year DFS nomogram model. The orange line represents an ideal nomogram, and the blue line represents the observed nomogram. Vertical bars indicate 95% CIs, and crosses indicate bias-corrected estimates. (D) Calibration curve for a 3-year DFS nomogram model. The orange line represents an ideal nomogram, and the blue line represents the observed nomogram. Vertical bars indicate 95% CIs, and crosses indicate bias-corrected estimates. (E) Time-dependent receiver operator characteristics curves by the nomogram for 1-, 3-, and 5-year DFS probability in the training cohort. AUC, the area under the curve of receiver operator characteristics; LMR, lymphocyte-to-monocyte ratio.

