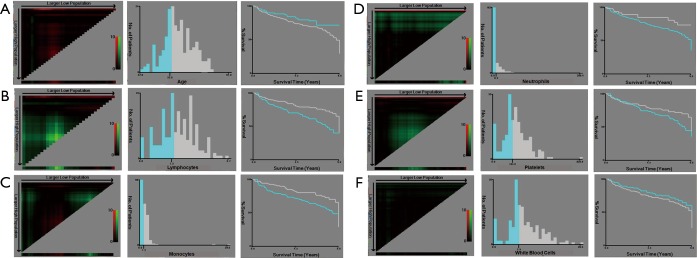
Figure S3.
X-tile analysis of the prognostic significance of age (A), lymphocytes (B), monocytes (C), neutrophils (D), platelets (E) and white blood cells (F) in the training cohort. Coloration of the plot representing the strength of the association at each division were shown in the left panels, ranging from low (dark, black) to high (bright, red or green). Red represents the inverse association between the expression levels and survival of the feature, whereas green represents a direct association. The optimal cut-off points were shown in a histogram (middle panels) and a Kaplan-Maier plot (right panels). The optimal cut-off points were defined by the most significant base in the X-tile analysis.

