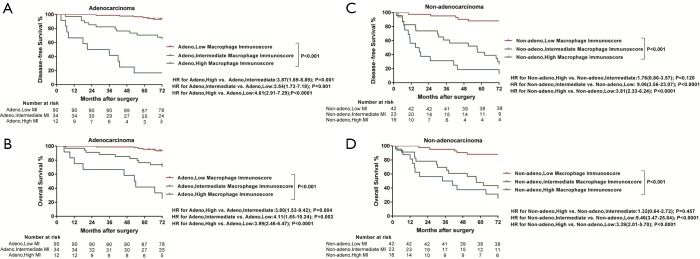
Figure S9.
Kaplan-Meier survival analysis of disease-free survival time and overall survival according to the MI and histology. (A) Kaplan-Meier curves for disease-free survival according to the MI of patients with adenocarcinoma in the training cohort. (B) Kaplan-Meier curves for overall survival according to the MI of patients with adenocarcinoma in the training cohort. (C) Kaplan-Meier curves for disease-free survival according to the MI of patients with non-adenocarcinoma in the training cohort. (D) Kaplan-Meier curves for overall survival according to the MI of patients with non-adenocarcinoma in the training cohort. MI, macrophage immunoscore.

