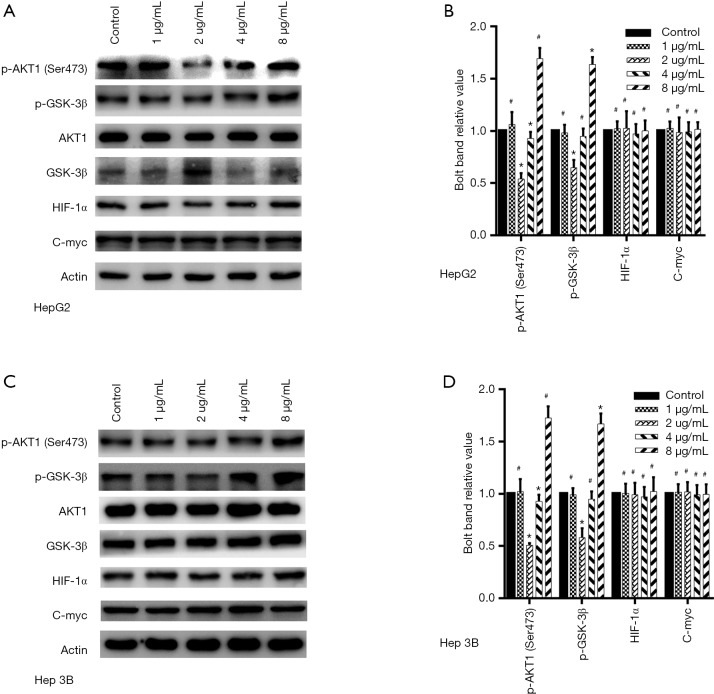
Figure 3.
Changes of Akt1/GSK-3β pathway treated by dezocine at different concentrations in protein level. (A,B) GSK-3β and Akt1 phosphorylation in HePG2 cells shared diverse changes after being treated by dezocine in 2 and 8 µg/mL, while HIF-1α and C-myc didn’t have statistically significant difference. (C,D) GSK-3β and Akt1 phosphorylation in Hep 3B cells shared diverse changes after being treated by dezocine in 2 and 8 µg/mL, while HIF-1α and C-myc didn’t have statistically significant difference. Data are represented as means ± SEM, n=3. *, P<0.05 vs. cells treated without dezocine; #P>0.1 vs. cells treated without dezocine.

