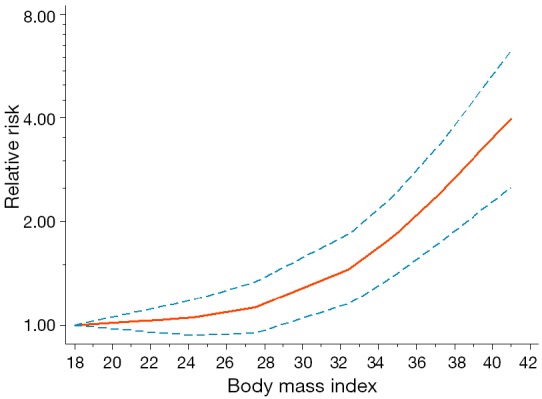
Figure 2.

Non-linear dose-response relationship between BMI (kg/m2) and the risk of PJI in patients undergoing primary THA or TKA. The red solid line represents the pooled RRs, and the blue dashed line represents corresponding 95% CIs. The RR is plotted on the log scale. BMI, body mass index; PJI, periprosthetic joint infection; THA, total hip arthroplasty; TKA, total knee arthroplasty; RRs, relative risks; CIs, confidence intervals.
