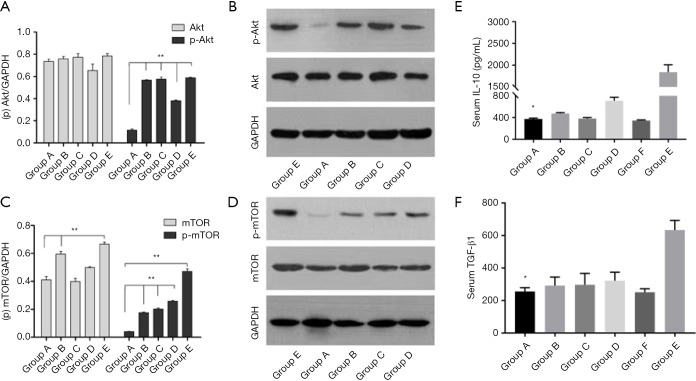
Figure 7.
The expression of akt-mTOR protein (A,B,C,D) and inhibitory cytokines (E,F) in different groups. (A,B) The p-akt was decreased significantly in group A compared with other groups, **P<0.01; (C,D) the mTOR and p-mTOR all decreased significantly in group A compared with other groups, **P<0.01. (E) Histogram of IL-10 between different groups analyzed with ANOVA, obviously down-regulation in group A, *P<0.05; (F) histogram of TGF-β1 between different groups analyzed with ANOVA, remarkably down-regulation in group A, *P<0.05. group A, SRL-based therapy/SRL+; group B, SRL/RAPA; group C, Thymalfasin/Zadaxin; group D, Huaier extract/PS-T; group E, HCC model; group F, Blank/Control.

