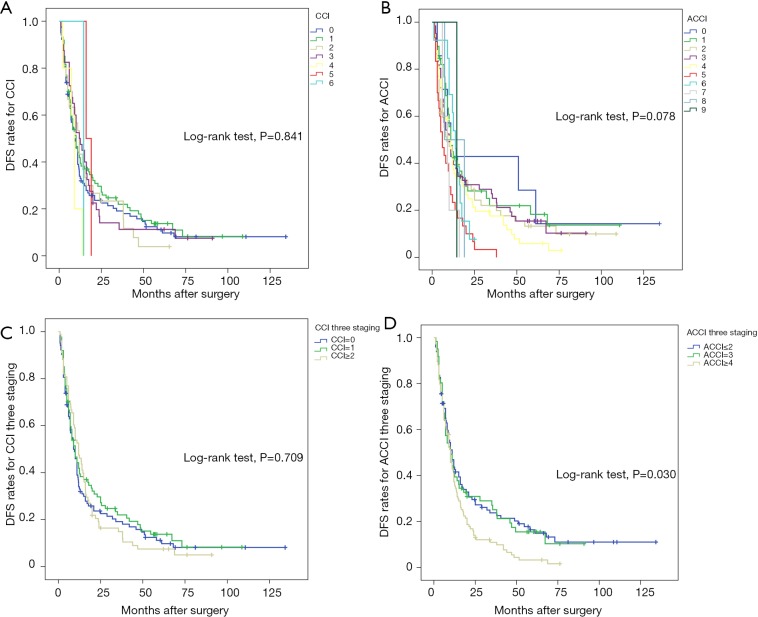
Figure 2.
Kaplan-Meier curve estimates of disease-free survival according to (A) CCI, (B) ACCI, (C) CCI three staging and (D) ACCI three staging. Survival probability is plotted on the Y-axis against postoperative time on the X-axis. Different color stands for different index scores. ACCI, age-adjusted Charlson Comorbidity Index; CCI, Charlson Comorbidity Index.

