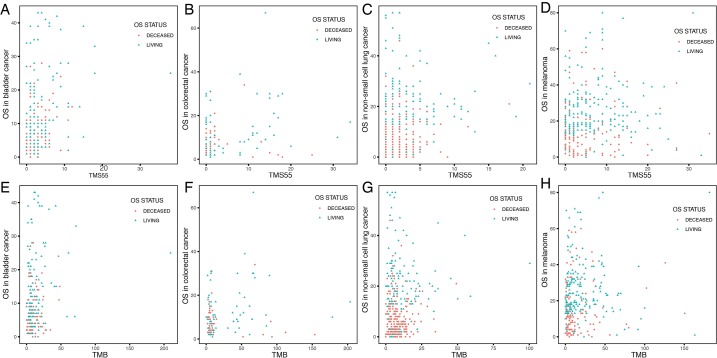
Figure S3.
Dot plots of the distribution of OS in patients based on TMS55 and TMB. (A,B,C,D) Distribution of overall survival (OS, months) based on TMS55 in bladder cancer, colorectal cancer, NSCLC and melanoma. (E,F,G,H) Distribution of overall survival (OS, months) based on TMS55 in bladder cancer, colorectal cancer, NSCLC and melanoma. Each dot represents each patient, and the color indicates the OS status after the follow-up. Generally, patients shifted right based on TMS55 compared to TMB.

