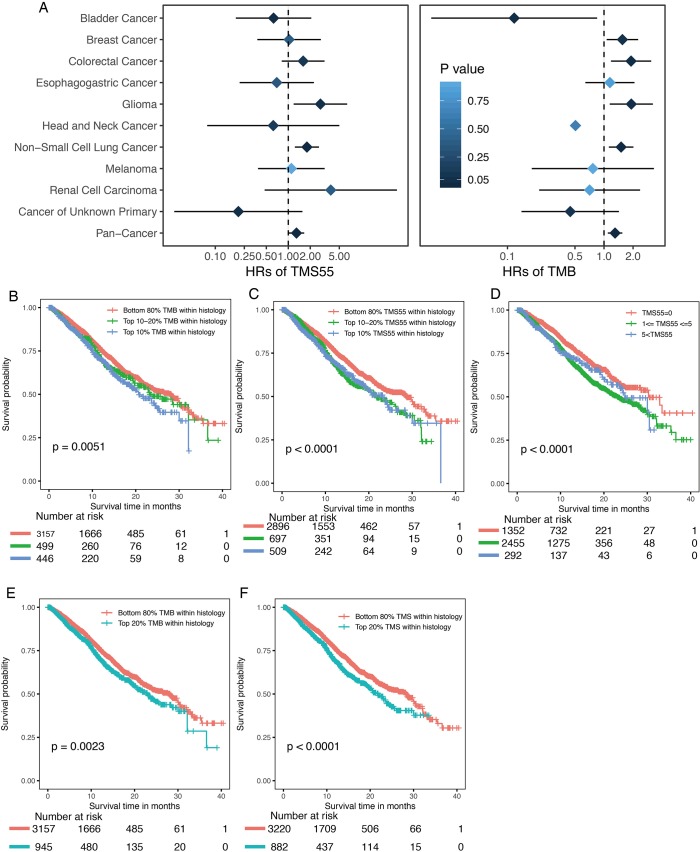
Figure S5.
Comparison between TMS55 and TMB in predicting survival in non-ICI-treated patients. (A) Forest plot of the comparison between TMS55 and TMB as biomarkers for patients without immunotherapy by cancer type. For TMS55, HRs and P values were compared between the TMS >5 and TMS =0 groups. For TMB, HRs and P values were compared between the top 10% and bottom 80% within each histology group. (B) Kaplan-Meier curve of pan-cancer patients divided into the bottom 80%, top 10-10% and top 10% TMB subgroups within each histology group. (C) Kaplan-Meier curve of pan-cancer patients divided into the bottom 80%, top 10-10% and top 10% TMS55 subgroups within each histology group. (D) Kaplan–Meier curve of pan-cancer patients divided into the TMS55 >5, 1≤ TMS55 ≤5, and TMS55 =0 groups. (E) Kaplan–Meier curve of pan-cancer patients divided into the bottom 80% and top 20% TMB subgroups within each histology group. (F) Kaplan-Meier curve of pan-cancer patients divided into the bottom 80% and top 20% total TMS subgroups within each histology group. Generally, a high TMS55, total TMS and TMB predicted poor OS in several cancer types.

