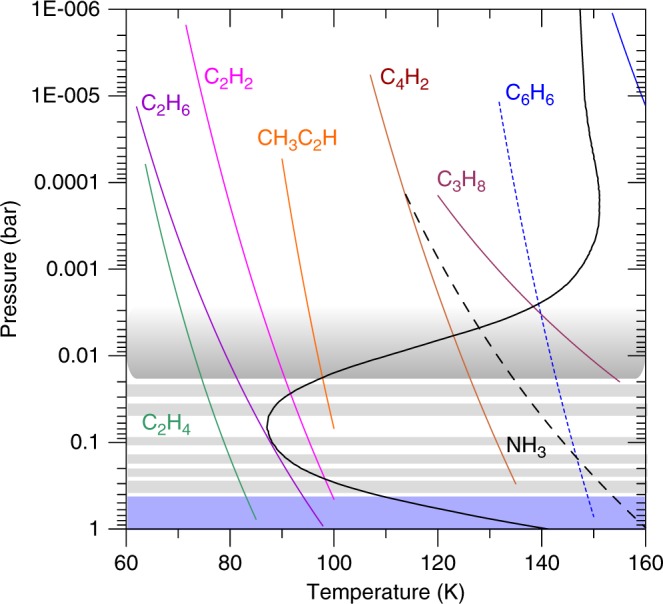
Fig. 4. Vertical temperature profile and saturation vapor-pressure curves for different hydrocarbons.

The reference altitudes used for the assumed hydrocarbon mole fractions are given as follows (Supplementary Fig. 6): C3H8 (10−7 at P = 3 mbar); C4H2 (3.8 × 10⁻¹² at P = 3 mbar); CH3C2H (7 × 10⁻¹¹ at P = 3 mbar); C2H2 (4.8 × 10⁻⁸ at P = 3 mbar); C2H6 (4.5 × 10⁻⁶ at P = 3 mbar); C2H4 (3 × 10⁻¹⁰ at P = 3 mbar). For C6H6, two values of the mole fraction are considered at two altitudes, with the corresponding saturation curves represented by two lines: blue continuous (mole fraction 7.7 × 10⁻¹² at P = 3 mbar, from ref. 33) and blue dashed (mole fraction 2.6 ×1 0−10 at P = 0.1 mbar from Supplementary Fig. 6). Condensation and haze base formation occur at altitudes where the saturation vapor-pressure curves intersect with the temperature profile. The location of the observed haze layers is indicated by horizontal gray bands.
