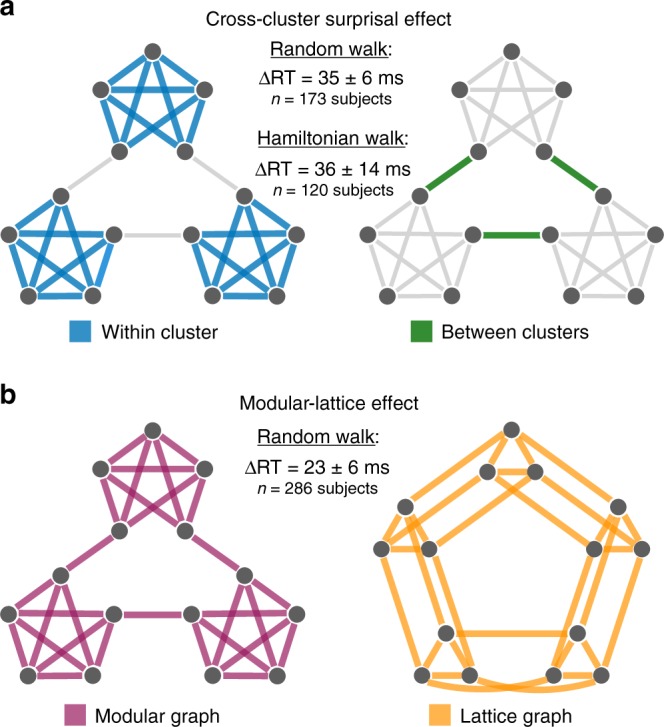
Fig. 2. The effects of higher-order network structure on human reaction times.

a Cross-cluster surprisal effect in the modular graph, defined by an average increase in reaction times for between-cluster transitions (right) relative to within-cluster transitions (left). We detect significant differences in reaction times for random walks (p < 0.001, t = 5.77, df = 1.61 × 10⁵) and Hamiltonian walks (p = 0.010, t = 2.59, df = 1.31 × 10⁴). For the mixed effects models used to estimate these effects, see Supplementary Tables 1 and 3. b Modular-lattice effect, characterized by an overall increase in reaction times in the lattice graph (right) relative to the modular graph (left). We detect a significant difference in reaction times for random walks (p < 0.001, t = 3.95, df = 3.33 × 10⁵); see Supplementary Table 2 for the mixed effects model. Measurements were on independent subjects, statistical significance was computed using two-sided F-tests, and confidence intervals represent standard deviations. Source data are provided as a Source Data file.
