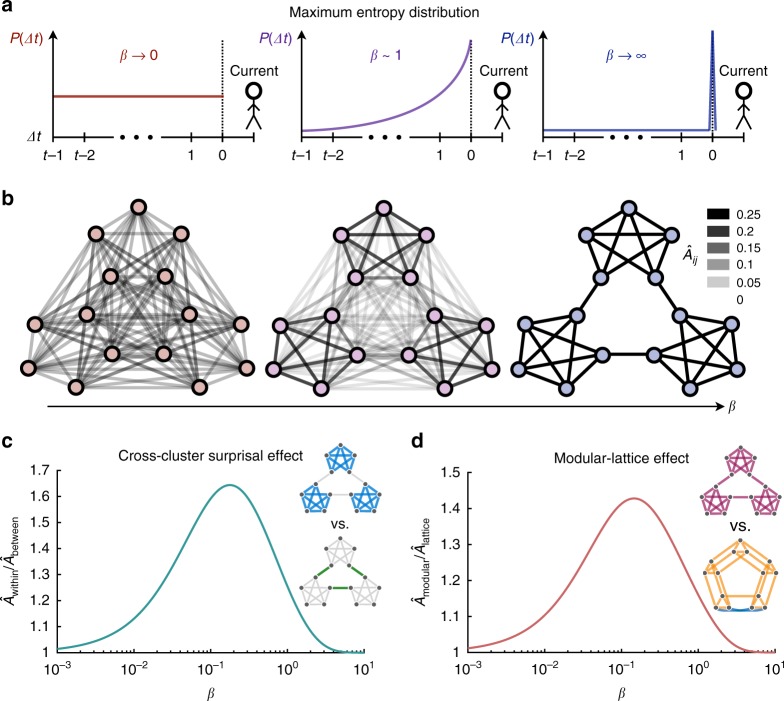
Fig. 3. A maximum entropy model of transition probability estimates in humans.
a Illustration of the maximum entropy distribution P(Δt) representing the probability of recalling a stimulus Δt time steps from the target stimulus (dashed line). In the limit β → 0, the distribution becomes uniform over all past stimuli (left). In the opposite limit β → ∞, the distribution becomes a delta function on the desired stimulus (right). For intermediate amounts of noise, the distribution drops off monotonically (center). b Resulting internal estimates of the transition structure. For β → 0, the estimates become all-to-all, losing any resemblance to the true structure (left), while for β → ∞, the transition estimates become exact (right). At intermediate precision, the higher-order community structure organically comes into focus (center). c, d Predictions of the cross-cluster surprisal effect (c) and the modular-lattice effect (d) as functions of the inverse temperature β.

