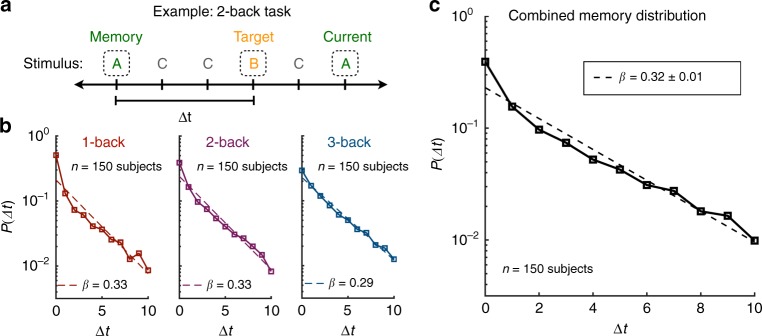
Fig. 5. Measuring the memory distribution in an n-back experiment.
a Example of the 2-back memory task. Subjects view a sequence of stimuli (letters) and respond to each stimulus indicating whether it matches the target stimulus from two trials before. For each positive response that the current stimulus matches the target, we measure Δt by calculating the number of trials between the last instance of the current stimulus and the target. b Histograms of Δt (i.e., measurements of the memory distribution P(Δt)) across all subjects in the 1-, 2-, and 3-back tasks. Dashed lines indicate exponential fits to the observed distributions. The inverse temperature β is estimated for each task to be the negative slope of the exponential fit. c Memory distribution aggregated across the three n-back tasks. Dashed line indicates an exponential fit. We report a combined estimate of the inverse temperature β = 0.32 ± 0.01, where the standard deviation is estimated from 1000 bootstrap samples of the combined data. Measurements were on independent subjects. Source data are provided as a Source Data file.

