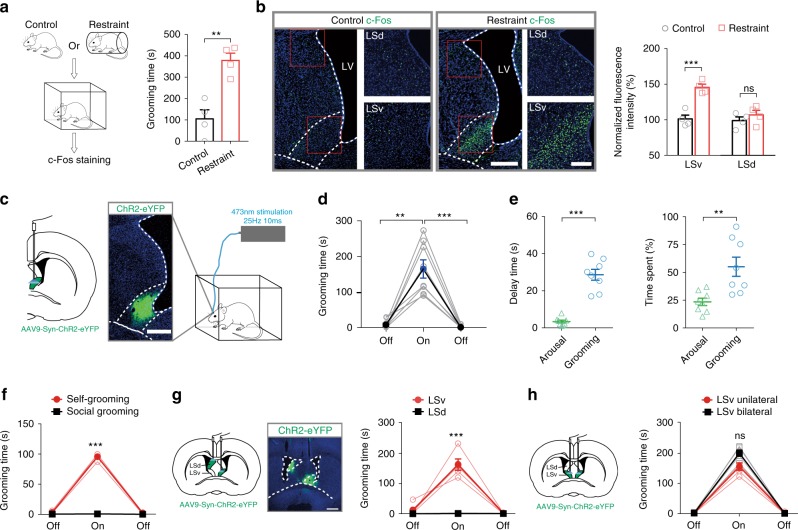
Fig. 1. Activation of ventral subdivision of LS triggers delayed but robust grooming behaviour.
a Body restraint imposed on rats for 20 min induced significantly increased grooming behaviour within 10 min compared with control, before sacrífice for c-Fos staining. n = 4; **P = 0.0024; Student’s unpaired two-tailed t-test. b Representative c-Fos staining revealing activation of neurons in LSv but not LSd following body restraint stress. Magnified LSd and LSv regions (red squares) are shown on the right. Scale bar, 500 μm (left), 200 μm (right). c Optogenetic activation of LSv by targeting an optic fibre at unilateral LSv that expressed ChR2-eYFP after injection with AAV9-hSyn-hChR2(H134R)-eYFP. Scale bar 500 μm. d A 5-min off +5-min on +5-min off optogenetic activation paradigm showed that activation of LSv neurons induced increased time spent in grooming behaviour (n = 8, One-way repeated measures ANOVA with Tukey post-hoc test, pre-off vs. on, **P = 0.0019; on vs. post-off, ***P = 0.0008). e Comparison of the delay and time spent in grooming and arousal behaviours, including rearing and heading, in the initial 2 min of LSv stimulation. Delay time, ***P < 0.0001; Time spent, **P = 0.0041; Student’s paired two-tailed t-test. f LSv optogenetic stimulation only induced self-grooming but not social grooming in the rat (comparison during light on period between the two behaviours: n = 3, Student’s paired two-tailed t-test, ***P < 0.0001). g Left panel: implantation of optic fibres targeting LSd and LSv in contralateral sides of the brain that expressed ChR2-eYFP. Right panel: only blue light stimulation of LSv (n = 4) but not LSd (n = 4) resulted in increased time spent in grooming. Scale bar, 1000 μm. (comparison during light on period between the two groups: Student’s paired two-tailed t-test, ***P < 0.0001). h No significant (ns) difference in the time spent in grooming between unilateral (n = 5) and bilateral (n = 4) LSv stimulation (comparison between the two groups during light on period: P = 0.0553, Student’s two-tailed t-test). All data are presented as mean ± SEM. See also Supplementary Table 1 for further statistical information. Source data are provided as a Source Data file.

