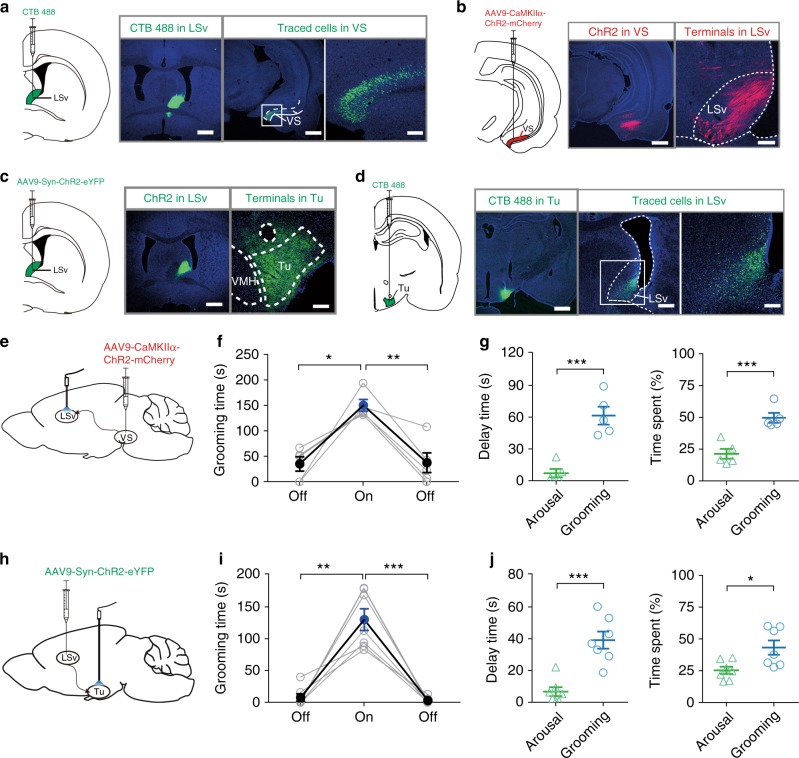
Fig. 2. Mapping upstream and downstream nuclei of LSv contributing to self-grooming.
a Retrograde labelling by CTB-488 microinjection in the LSv resulted in prominent expressions in the ventral subiculum (VS) of the hippocampal formation in the ipsilateral brain. Scale bar, 1000 μm. Inset shows enlarged ventral subiculum. Scale bar, 200 μm. b Anterograde tracing by injection of AAV9-CamIIKα-ChR2-mCherry confirmed the VS-LSv projection. Left, scale bar, 1000 μm; Right, scale bar, 200 μm. c Anterograde tracing by AAV9-hSyn-hChR2(H134R)-eYFP microinjection in the LSv resulted in prominent expressions in the tuberal nucleus (Tu) of the lateral hypothalamus. Left, scale bar, 1000 μm; Right, scale bar, 200 μm. d Injection of CTB-488 into Tu confirmed the LSv-Tu projection. Left, scale bar, 1000 μm; middle, scale bar 500 μm; Right, scale bar 200 μm. e and f Optogenetic activation of the VS → LSv pathway for 5 min at 25 Hz induced increased grooming behaviour that was significantly higher than those in the 5-min pre-light and post-light-off periods (n = 5, One-way repeated measures ANOVA with Tukey post-hoc test, F (1.489, 5.954) = 13.05, P = 0.0083; off vs. on, *P = 0.0189; on vs. post-off, **P = 0.0096). g Comparison of the delay and time spent in grooming and arousal behaviours, including rearing and heading, in the initial 2 min of stimulation. n = 5; delay time, ***P = 0.0004; time spent, ***P = 0.0009; Student’s paired two-tailed t-test. h and i Optogenetic activation of the LSv → Tu pathway for 5 min induced increased grooming behaviour that was significantly higher than those in the 5-min pre-light-off and post-light-off periods. (n = 7, one-way repeated measures ANOVA with Tukey post-hoc test, F (1.104, 6.622) = 39.73, P = 0.0004; pre-off vs. on, **P = 0.0025; on vs. post-off, ***P = 0.0010). j Comparison of the delay and time spent in grooming and arousal behaviours, including rearing and heading, in the initial 2 min of stimulation. (n = 7; delay time, ***P = 0.0002; time spent, **P = 0.0147; Student’s paired two-tailed t-test). All data are are presented as mean ± SEM. Source data are provided as a Source Data file.

