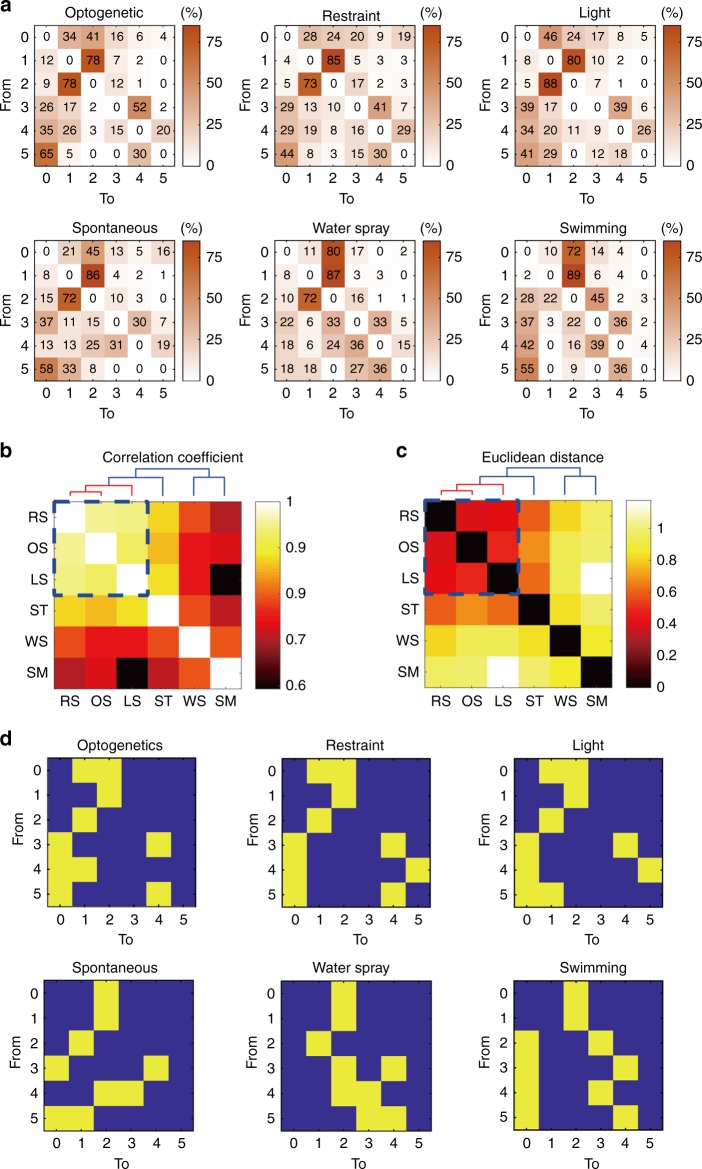
Fig. 7. Microstructure analysis of grooming under different contexts.
a The transition probability matrices summarizing the likelihood from one grooming phase to another phase in the six grooming models. The different phases of no grooming/grooming activities were defined as no grooming (phase 0), paw licking (phase 1), nose/face/head grooming (phase 2), body grooming (phase 3), leg grooming (phase 4) and tail/genital grooming (phase 5). The numbers show the occurrence in % and are colour-coded. b, c The correlation coefficients b, and Euclidean distances c between each pair of transition probability matrices were derived. Hierarchical clustering analysis supports a higher similarity of the optogenetics model and the restraint and light models. RS body restraint stress, OS optogenetics stimulation of LSv, LS bright light exposure, ST spontaneous grooming, WS water spray, SM swimming. d The patterns and microstructures of six grooming models summarized by the phase transition probability matrix shown in a were transformed into two-colour binary format using a threshold of 25% illustrating higher similarity among the optogenetics model, the restraint model and the light model.

