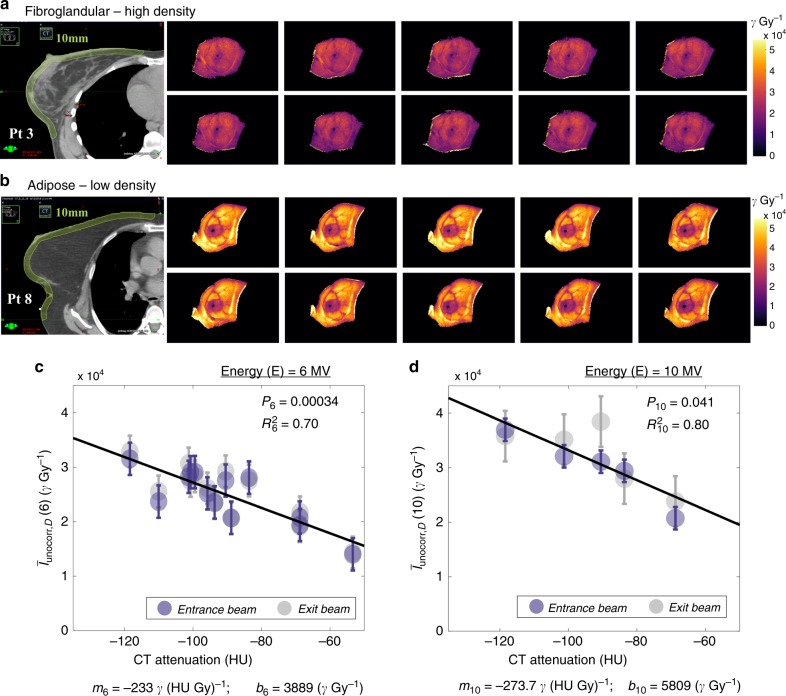
Fig. 4. Variability in Cherenkov intensity with fibroglandular and adipose tissue content.
In a, the CT scan of Patient 3 shows dense, fibroglandular content throughout the breast volume. Ten fractions of Cherenkov imaging are pictured (units photons (γ)), each normalized with respect to dose (Gy) as shown beside this. In (b), the CT scan of Pt 8 is characterized by largely adipose tissue, resulting in a much brighter appearance of Cherenkov images as compared those in a. Subfigures c and d illustrate the linear correlation between HU and the median Cherenkov counts per unit delivered dose (γ Gy−1), averaged over the number of fractions imaged (mean). Beams are separated by color (Entrance/RPO, gray and Exit/LAO, blue). Subfigure (c), n = 13, maps this relationship for all 13 patients treated with 6 MV beams, and (d), n = 5, for the five patients treated with 10X beams. Each point shown is averaged over all fractions for each patient (see Table 1 for number of fractions). RPO and LAO means for each patient were averaged into one point, and the linear correction was computed and applied to each Cherenkov (γ Gy−1) value for both 6X and 10X beams to normalize the Cherenkov signal by HU value (Supplementary Fig. 2b, d). Error bars shown depict the root mean square error.

