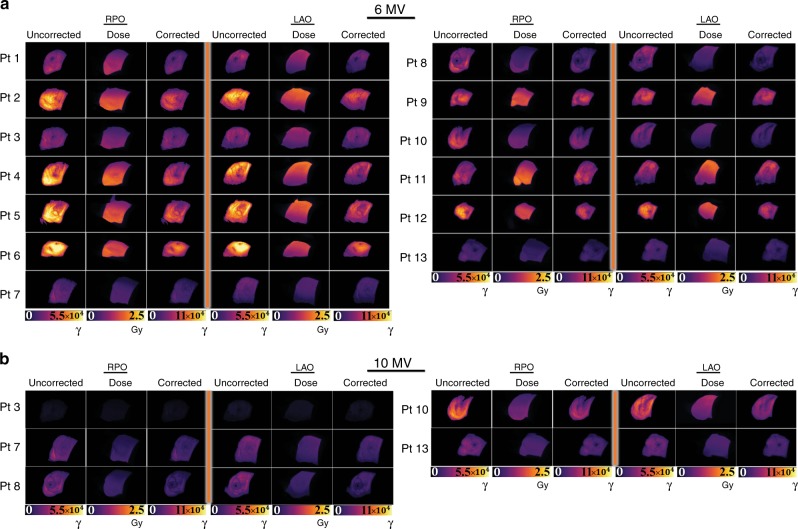
Fig. 5. Cherenkov images corrected for radiodensity.
The final corrected RPO and LAO images are shown. Subfigure (a) organizes the original (labeled Uncorrected) Cherenkov images recorded during 6 MV radiotherapy treatment (units in Cherenkov photons, γ) as compared to the expected surface dose estimate (labeled Dose) from the treatment plan (Gy). After CT attenuation (HU) corrections have been carried out, the corrected Cherenkov images are shown (labeled Corrected). In (b), the same is shown for 10 MV beams. The corrected Cherenkov images qualitatively match the expected surface dose images more closely than the uncorrected images, where further quantitation is presented in Fig. 6.

