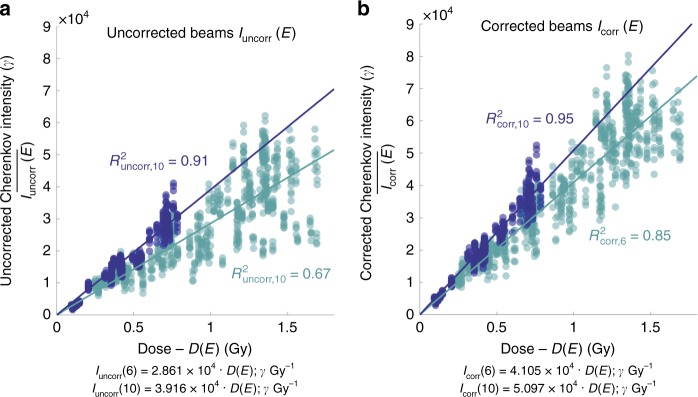
Fig. 6. The HU correction increases linearity between Cherenkov light and dose.
The same number of regions of interest (ROI) per patient are sampled from each corrected and uncorrected Cherenkov image stacks and co-registered surface dose images to yield the relationships shown. The median Cherenkov intensities from uncorrected images (a) are plotted against corresponding ROIs from the predicted dose in the treatment plan. The median Cherenkov intensities from the corrected images are then plotted in the adjacent plot (b) for both 6 and 10 MV beams. The y-intercepts have been constrained to cross at the origin, which yields an uncorrected 6X beam regression R2uncorr,6 = 0.67 (light blue), which exhibits the largest spread of data. The HU-corrected 6X beam regression is improved by 0.18, to R2corr,6 of 0.85. The linear regression of the 10X beams are improved slightly by 0.04, from 0.91 to 0.95 (dark blue). The Pearson’s linear correlation coefficient increased from runcorr,6 = 0.82 uncorrected to rcorr,6 = 0.92 corrected in 6X beams, and from runcorr,10 = 0.96 uncorrected to rcorr,10 = 0.97 corrected for the 10X beams. All data are organized by beam energy, where light blue is representative of all 6 MV data and dark blue is representative of all 10 MV data.

