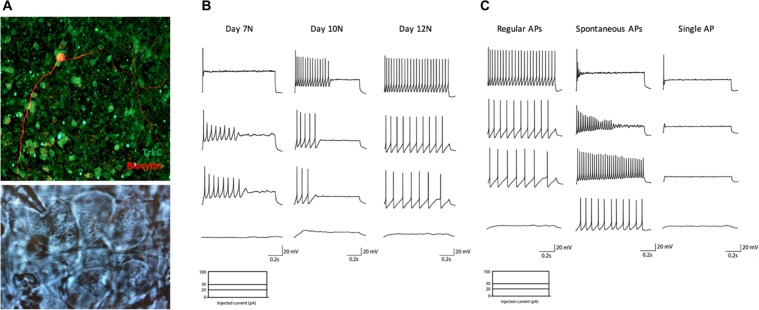
Figure 8.
(A) (Up) Representative image of biocytin-filled TrkC+ neuron. (Down) Representative image of neurons identified with a 63x water immersion objective and an infrared CCD camera during electrophysiological recording. They showed the typical morphology of large sensory pseudo-unipolar neurons. Time course analysis of electrophysiological excitability of differentiated neurons. (B) Representative traces of current-clamp recordings in cells at day 7 (left) 10 (middle) or 12 (right) of treatment with neurotrophic factors (days 15, 18, 20 of differentiation), in response to depolarizing current injection steps at 0 pA (lower trace) 20, 30 and 100 pA (higher trace). (C) Representative traces of current-clamp recordings in cells at day 12 of treatment with neurotrophic factors, in response to 0 (lower traces) 20, 30 and 100 pA (higher traces) of depolarizing current injection steps. Three different responses were observed: regular APs firing with firing frequency increasing for higher current injections (left); spontaneous activity with rapid accommodation following increasing step current injections (middle); single AP in response to higher injecting currents (right).

