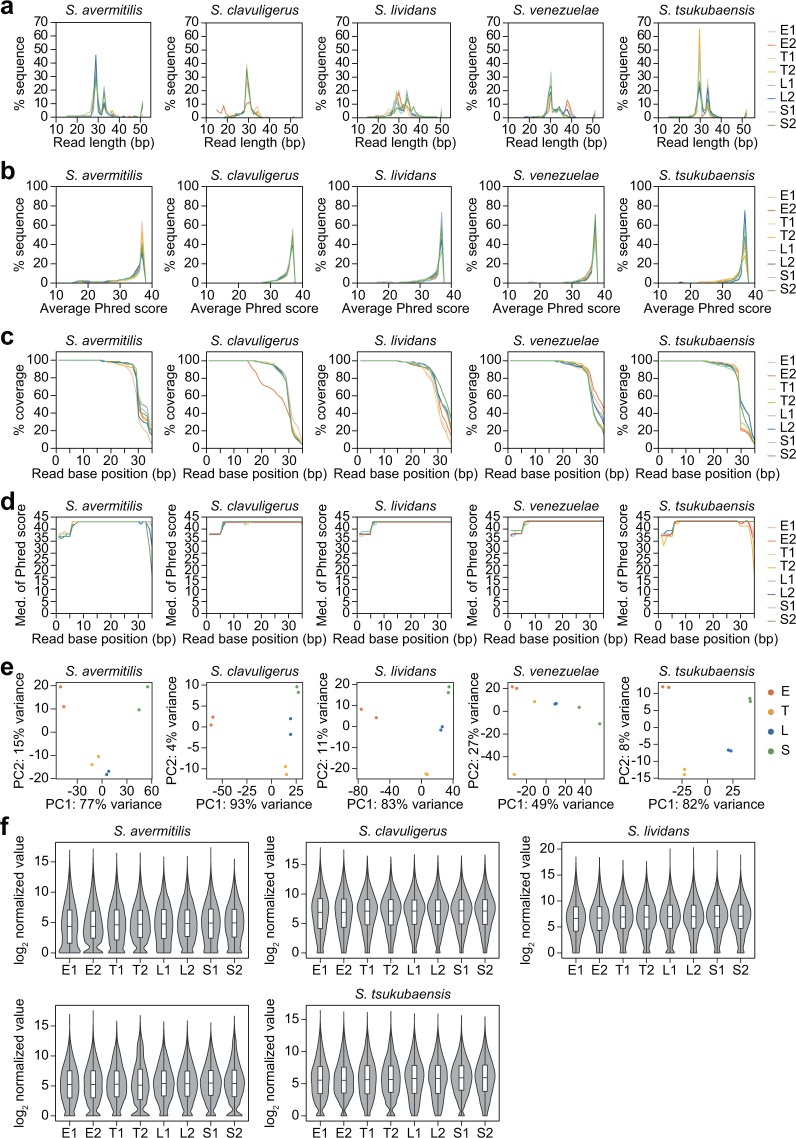
Fig. 3.
Read quality analysis of ribosome profiling samples of five Streptomyces species at the four growth phases. The replicate of each growth phase is represented as “1” or “2” after the growth phase. (a) Read length distribution of trimmed reads. (b) Distribution of average Phred scores of the trimmed reads. (c) The number of sequences that cover individual base positions normalized to the total number of sequences at each base position. (d) The distribution of median Phred quality scores that were observed at each base position. (e) PCA plot of ribosome profiling mapped reads of each gene. (f) Violin and box plot of the log2 normalized expression values.

