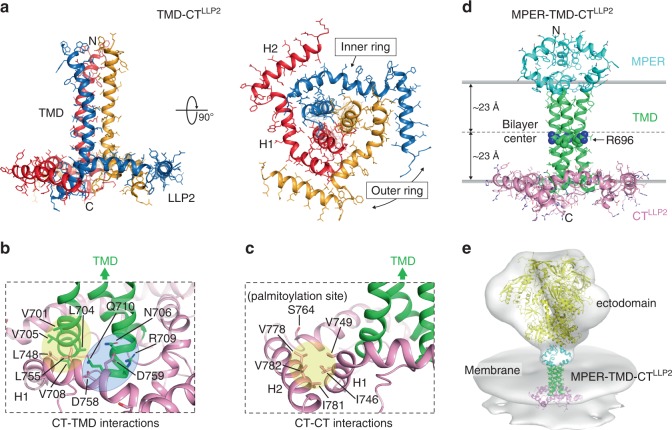
Fig. 1. Structures of TMD–CTLLP2 and MPER–TMD–CTLLP2 trimers in bicelles.
a Ribbon representation of the TMD–CTLLP2 average structure from the calculated ensemble. The unstructured KS (residues 711–736) is omitted for clarity. The H1 and H2 helices forming the inner and outer rings of the CT baseplate, respectively, are indicated in the bottom view (right). b Close-up view of the residues establishing the CT–TMD interactions. Hydrophobic and hydrophilic interactions are shaded in yellow and light blue, respectively. The TMD and the CT are shown as green and pink ribbons, respectively. c Same as (b) but for the CT–CT interactions. The palmitoylation site C764 (S764 in our construct) faces the lipid bilayer interior. d Ribbon representation of the merged MPER–TMD–CTLLP2 model showing the MPER, TMD, and CTLLP2 in cyan, green, and pink, respectively. The placement of the structure in the lipid bilayer was determined experimentally using the PPT method25. The conserved intramembrane R696 is represented as spheres. e Fit of the MPER–TMD–CTLLP2 model and the structure of the SOSIP Env trimer (yellow; pdb ID: 5T3Z61) into the low-resolution EM density (gray) of the HIV-1 Env trimer on the virion surface by cryo-electron tomography10 (Env trimer EMDB ID: EMD-5019; viral membrane EMDB ID: EMD-5020).

