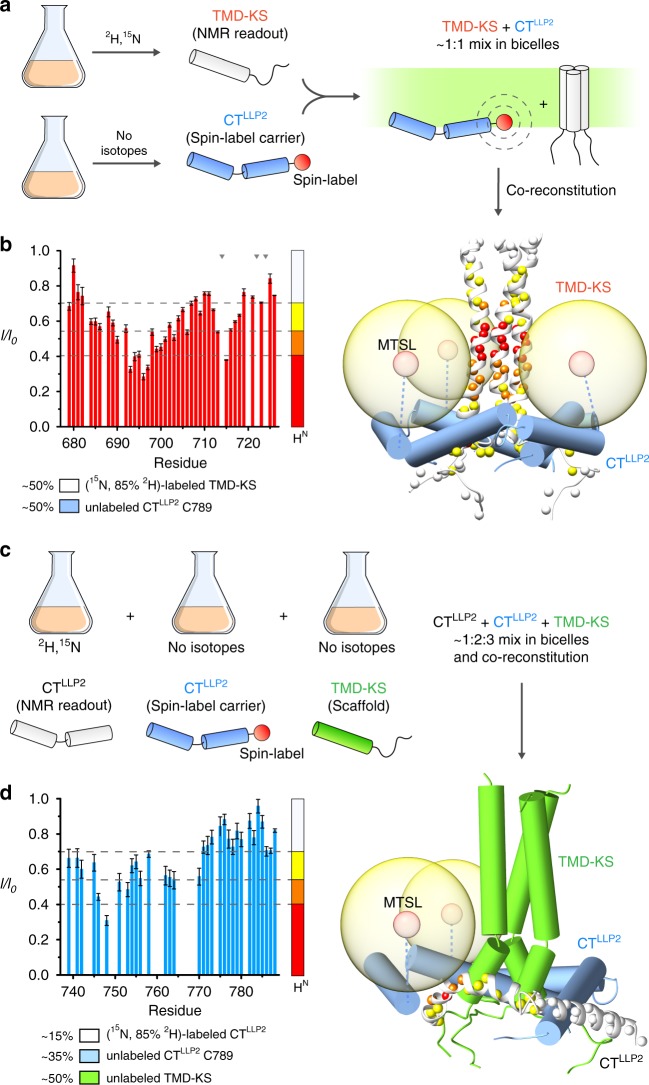
Fig. 2. Independent evidence of CTLLP2–TMD interaction.
a Schematic illustration of the sample preparation strategy used for intermolecular PRE analysis. TMD–KS and CTLLP2 (C789) are expressed separately: TMD–KS is isotopically-enriched for NMR readout while CTLLP2 carries the spin-label (at C789). After purification, the two segments are mixed at ~1:1 molar ratio and co-reconstituted in bicelles. Upon interaction, the TMD–KS is expected to experience PRE generated by the CTLLP2 spin-label. b Residue-specific PRE (I/I0) of (15N, 85% 2H)-labeled TMD–KS mixed with MTSL-labeled CTLLP2 (left). Error bars represent the uncertainty derived from cross-peaks signal to noise. Missing bars are due to prolines (indicated by gray triangles) or overlapping residues. The horizontal dash lines mark the four PRE regimes used to map the PREs onto the protein structure (right). The TMD–KS and the CTLLP2 are shown as white ribbons and blue cylinders, respectively. c Labeling scheme for probing intermolecular CTLLP2–CTLLP2 interaction. CTLLP2 (white) is isotopically-enriched for NMR readout while CTLLP2 (blue) carries the spin-label at C789, and TMD–KS (green) serves as scaffold. After purification, the three proteins are mixed at ~1:2:3 molar ratio, respectively, and co-reconstituted in bicelles. d Residue-specific PRE (I/I0) of (15N, 85% 2H)-labeled CTLLP2 mixed with MTSL-labeled CTLLP2 and scaffold TMD–KS (left). Error bars represent the uncertainty derived from cross-peaks signal to noise. Missing bars are due to overlapping residues. The horizontal dash lines mark the four PRE regimes used to map the PREs onto the protein structure (right). Source data are provided as a Source data file.

