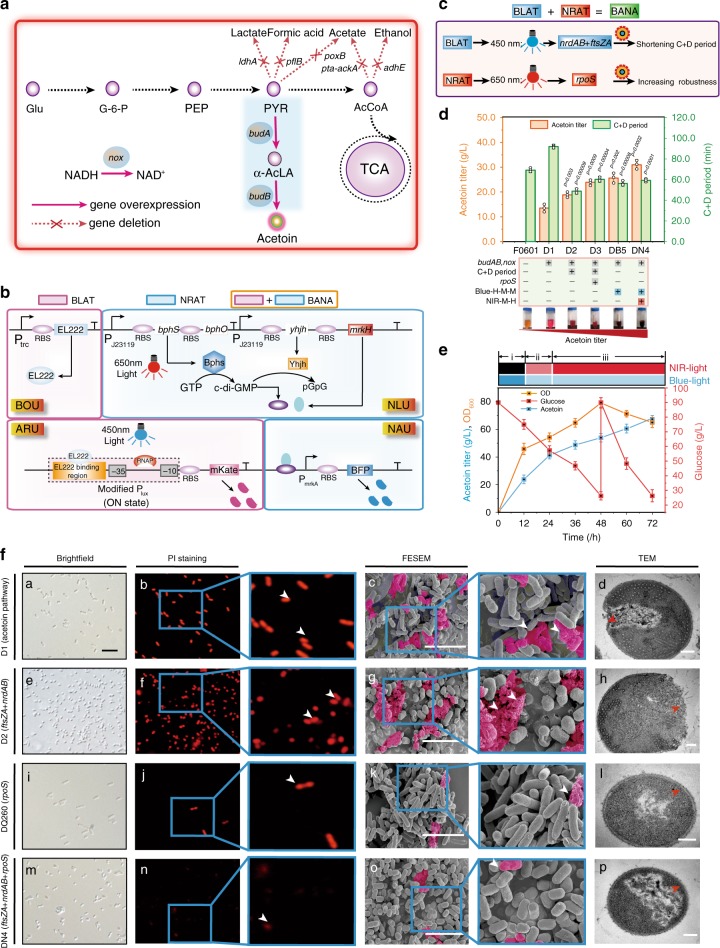
Fig. 5. Shortening cell division for acetoin production by the BANA system.
a The schematic diagram of acetoin biosynthesis pathway in E. coli D1. b The schematic diagram of BANA containing the BLAT and NRAT. c Enhancing acetoin production by BANA regulation. BLAT was used to control nrdAB and ftsZA, and at the same time NRAT controlled rpoS. d Effect of illumination combination on the C+D periods and acetoin production. H, M, and L were 0.8, 0.3, and 0.2 W/cm2, respectively (Supplementary Fig. 27A–C). The genes in the C+D periods of cell division were constitutively expressed in E. coli D1, resulting in E. coli D2. The rpoS gene was constitutively expressed in E. coli D2, resulting in E. coli D3. The genes in the C+D periods of cell division were controlled by blue light in E. coli D1, resulting in E. coli DB5 (Blue-H-M-M represented 0.8 W/cm2 blue-light in phase I and 0.3 W/cm2 blue-light in phase II and phase III). The rpoS gene was controlled by NIR-light in E. coli DB5, resulting in E. coli DN4 (NIR-M-H represented 0.3 W/cm2 NIR-light in phase II and 0.8 W/cm2 NIR-light in phase III (Supplementary Fig. 30A, B, and Supplementary Note 6). The inserted figure was the creatine color reaction. e Acetoin production with the engineered E. coli DN4 controlled by light stimulation during fed-batch fermentation. f Effect of shortening cell division on cell morphology during acetoin production. The rpoS gene was constitutively expressed in E. coli D1, resulting in E. coli DQ260. The scale bar for c, g, k, o are 5 μm. For d, h, l, p are 0.2 μm. For a, e, i, m are 5 μm. d, e Values are shown as mean ± s.d. for n = 3 biological independent replicates. Glu glucose, G6P glucose-6-phosphate, PYR pyruvate, PEP phosphoenolpyruvate, AcCoA acetyl-CoA, α-acLA α-acetolactate, α-ackA acetate kinase A, adhE alcohol dehydrogenase, ldhA lactate dehydrogenase, poxB pyruvate oxidase, pflB pyruvate-formate lyase; pta phosphate acetyl transferase, budA α-acetolactate synthase, budB α-acetolactate decarboxylase, nox NADH oxidase. Significance (p-value) was evaluated by two-sided t-test, compared to E. coli D1. Source data underlying Fig. 5d–f are provided as a Source data file.

