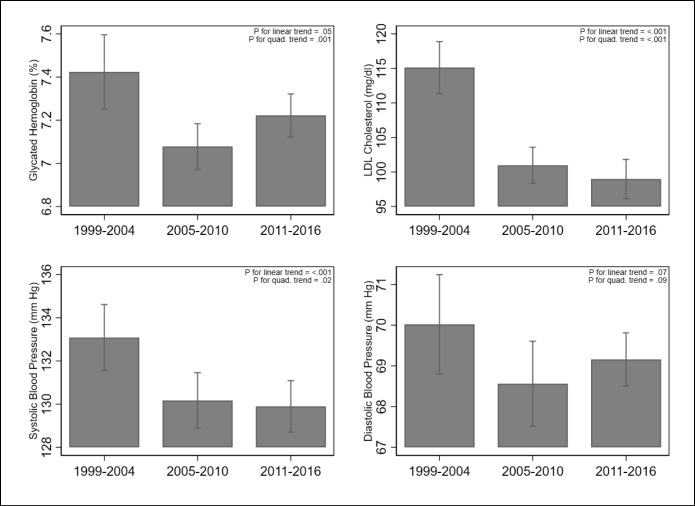
Figure 1.
Mean glycated hemoglobin, low-density lipoprotein cholesterol, systolic blood pressure, and diastolic blood pressure among US adults with diagnosed diabetes, 1999–2016. This figure shows mean HbA1c (top left), LDL cholesterol (top right), systolic blood pressure (bottom left), and diastolic blood pressure (bottom right) for US adults with diagnosed diabetes at three consecutive time periods (1999–2004, 2005–2010, and 2011–2016). Estimates are weighted and come from pooled data using the National Health and Nutrition Examination Study. P values are for linear regression models where data was unpooled and time was entered as a linear and quadratic term, respectively. Estimates for LDL cholesterol levels were derived from a random subsample of fasting respondents using Friedewald’s formula.

