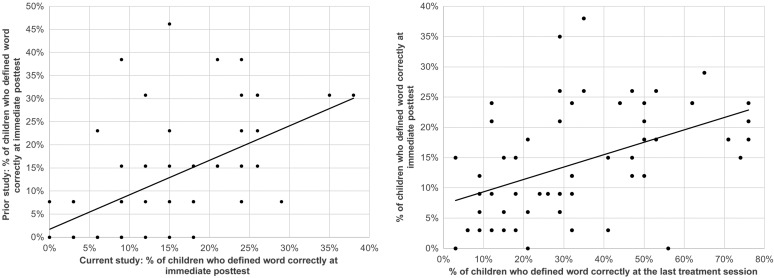
Figure 6.
The left panel shows the percentage of children defining a word correctly at the immediate posttest in the prior preliminary clinical trial (Storkel, Voelmle, et al., 2017) compared to the percentage of children defining a word correctly at the immediate posttest in the current study. The right panel shows the percentage of children defining a word correctly at the last treatment session (in the current study) compared to the percentage of children defining a word correctly at the immediate posttest (in the current study). The line in both panels is the linear fit line.

 This work is licensed under a