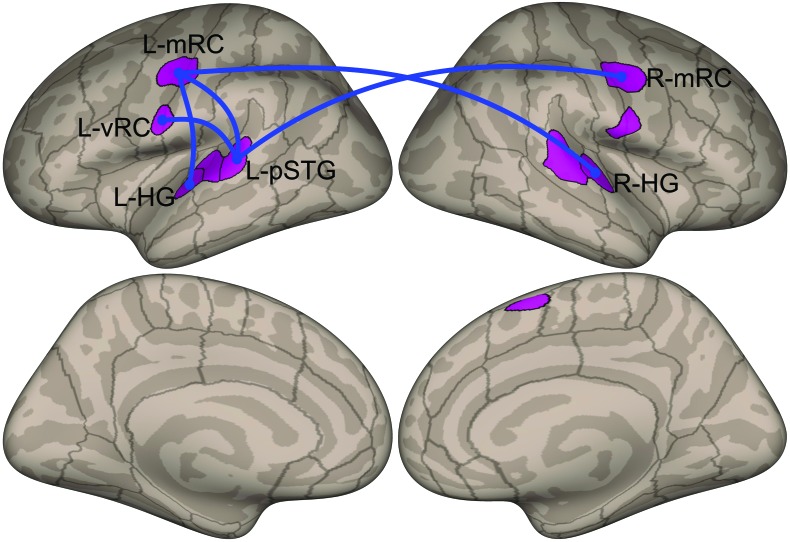
Figure 4.
ROI-to-ROI resting-state functional connectivity results. We used the ROIs defined based on the localizer task to conduct ROI-to-ROI connectivity analysis. Blue lines indicate connections with significantly higher functional connectivity for the adductor spasmodic dysphonia group compared to the control group (p < .05, false discovery rate analysis level corrected for the number of ROIs included in the analysis as seed and target ROIs). See Figure 1 for ROI definitions. ROI = region of interest; L = left; R = right; mRC = mid-Rolandic cortex; vRC = ventral Rolandic cortex; pSTG = posterior superior temporal gyrus; HG = Heschl's gyrus.

