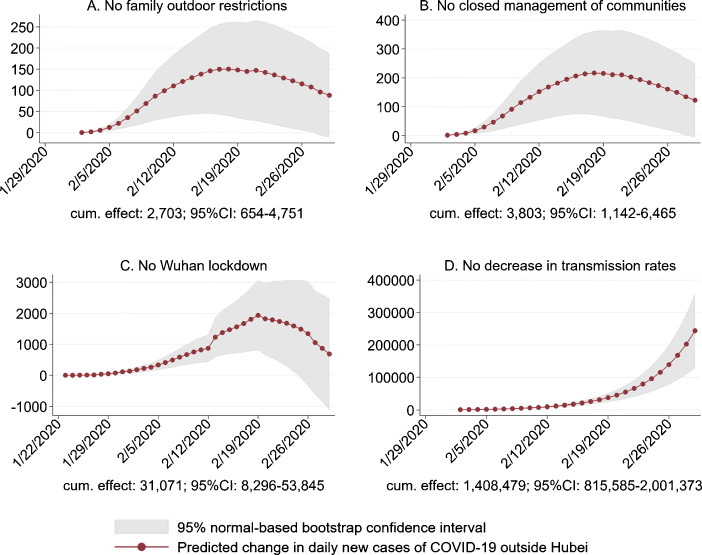
Fig. 7.
Counterfactual policy simulations. This figure displays the daily differences between the total predicted number and the actual number of daily new COVID-19 cases for each of the four counterfactual scenarios for cities outside Hubei province in mainland China. The spike on February 12 in scenario C is due to a sharp increase in daily case counts in Wuhan resulting from changes in case definitions in Hubei province (see Appendix B for details)

