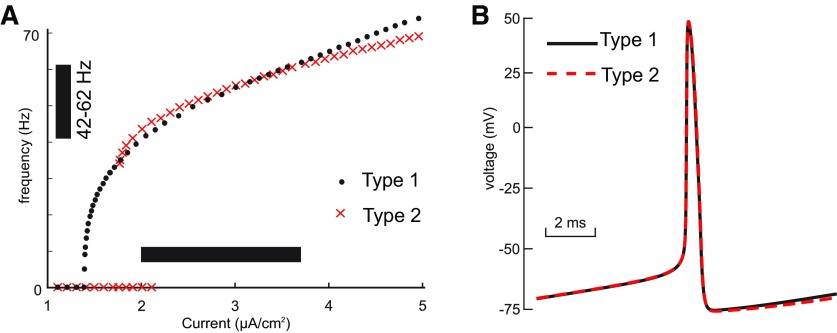
Figure 2.
Model calibration. The parameters of the model for both types (parameters given in Table 1, attributes in Table 2) were adjusted to make the comparison as fair as possible. A, Frequency/current (F/I) curves for type 1 (black dots) and type 2 (red crosses) overlap for the range of bias currents (horizontal bar) used in our heterogeneous networks. The vertical bar shows the range of frequencies exhibited at the heterogeneous bias current levels. The F/I curves were measured using current steps of sufficient duration to allow any transients to die out and establish a steady frequency. Arbitrarily slow frequencies can be obtained for type 1 (data not shown) near the bifurcation, but type 2 has a minimum cutoff frequency below which it cannot fire. Current steps were additive (the membrane potential was not returned to rest between steps). After stepping up, the current was stepped down to reveal the bistable region. The bistable range for type 2 is evident from the current values at which a zero-frequency quiescent solution coexists with a repetitively firing solution. This region was determined using XPPAUTO. B, The spike shapes and the ISI are very similar for type 1 (black curve) and type 2 (red dashed curve); .

