Figure 4.
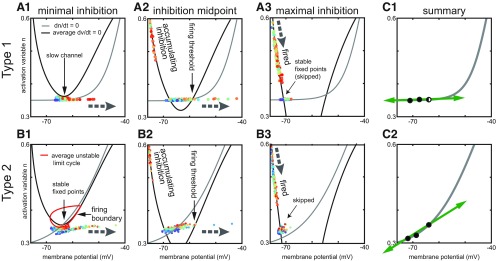
Phase plane analysis of heterogeneous inhibitory interneuronal networks with hyperpolarizing inhibition. Large gray dashed arrows show the local direction of motion in the vector field. Other thin black arrows simply point out a specific feature. These phase plane portraits are similar to those in Figure 1 with two exceptions. First, the V-nullcline (black curves) shown is an average across the heterogeneous population. Thus, the fixed points shown are also an average, and actually differ for each neuron. Second, the time-varying levels of inhibition between the neurons causes the position of the average V-nullcline to fluctuate in time. The slow n-nullcline (gray) is constant for each type. Each dot represents the current position of one neuron in the network, with the fastest neurons in red and the slowest in blue (there is also a contribution to the dynamics by the number of active inhibitory inputs to each neuron, which cannot be inferred from the color code). Movement in the horizontal direction is fast compared with that in the vertical direction because the slow variable is plotted along the y-axis. A, Type 1. A1, Minimal inhibition creates a slow channel between the nullclines (vertical arrow). A2, Inhibition midpoint. As neurons escape to the right (horizontal arrow shows direction of motion) and fire an action potential, inhibition accumulates and moves the average V-nullcline down. The right branch of the V-nullcline is the firing threshold (vertical arrow). A3, Maximal inhibition. The population is segregated into two groups. One group that fired on the most recent network cycle slowly moves down (thick arrow at top shows direction of motion) along the stable left branch of the average V-nullcline. The other group (diagonal arrow) skipped this cycle and tends to line up along the flat portion of the n-nullcline. B, Type 2. B1, Minimal inhibition. In contrast to the absence of a fixed point in A1, there is a stable fixed point (technically fixed points, vertical arrow) at the intersection of the average V-nullcline and the n-nullcline. This fixed point is surrounded by an unstable limit cycle (red curve) that forms the boundary between spiking and quiescent trajectories. B2, Inhibition midpoint. As in A2, inhibition accumulates as neurons escape to the right and fire action potentials. The right branch of the V-nullcline is now the firing threshold (vertical arrow). B3, Inhibition maximum. As in A3, two groups are evident corresponding to those that fired and those that skipped. C, Summary. C1, This panel shows that the movement of the fixed point as inhibition waxes and wanes is (leftward) in the fast, horizontal direction for type 1. C2, In contrast, the downward and leftward movement of the fixed point for type 2 has a component in the slow direction, which helps equalize the opportunity of slow neurons to fire as compared with fast neurons.

